
Installation and Operation Manual


NCL1100 Installation & Operation Manual
1990/07/21 – 8 –
2-5 Error Messages
When there are problems, the system displays these error messages:
• Unable to open file The InterBuilding Link.CFG
Cause: The configuration file for IBL.EXE was not present in the current directory
when you started the NCL1100, or the file does not exist.
Cure: Type
dir and the file name at the C> prompt to ensure that the IBL.EXE
and Link.CFG files are present. If the files are not present, use the
WaveRider Communications website at www.waverider.com for
technical support.
• Network Card Error : Loopback test failed
Cause: The NCL1100 could not perform a successful loopback test on the
network card. The failure may be due to an incorrect cable connection,
incorrect cable termination, or a severe network load during the loopback
test.
Cure: Ensure that the LAN cable is connected and terminated properly, then try
again. If the problem persists, disconnect the network card and
terminate it, then try again. If this fails, replace the card.
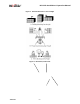
3 Diagnostics
The NCL1100 has a VGA-compatible output connector on the back of the unit. If you
experience problems with the system, plug a standard VGA-compatible monitor into this
connector to display the diagnostic screens. Once you connect a VGA-compatible monitor to
the unit, you can monitor several things while the link is operating, without affecting the link.
Also, you can add a standard PC keyboard to execute other diagnostic commands.
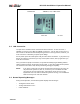
As the NCL1100 loads, the initial test routines display messages. A failed test points to the
possible problem, such as a poor LAN or RF connection on the back of the unit.
After the Network Communications Link is loaded, it displays an inactive status screen. To
activate the status screen, press the
R key once. The system begins to display activity in real
time, and updates the display screen approximately once every second. The information
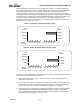
includes the bar graphs illustrated in Figure 5, Figure 6, and Figure 7.
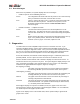
RF Outgoing, Incoming:
The graph on the right-hand side of the screen shows the transmitting
and receiving utilization per second of the RF section of the system.
LAN Outgoing, Incoming:
The graph on the left-hand side of the screen shows the transmitting and
receiving utilization per second of the LAN section of the system.
Filtered: The graph on the left-hand side of the screen shows the percentage of
incoming LAN packets that were filtered.
Overload: This is the percentage of incoming LAN packets that are discarded due
to full internal buffers. The packets are discarded by the FIFO method,
i.e., the oldest packet is discarded first.
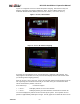
All throughput displays are a percent of utilization, that is, the graph is from zero to one
hundred percent, which is the percentage of total throughput available. On an 11 Mb/s link,
one hundred percent throughput equals 11 Mb/s.
Figure 3 is the display screen in the normal mode, with no packet activity to generate bar
graphs on the screen.