
User's Manual Part 2


172 APCD-LM043-8.0 (DRAFT C)
11: Monitoring the Network
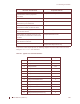
As with the CCU transmit statistics, the following sample calculations can be made using the
sample data from Table 31:
Total number of desired payloads = B + C = 45,879 + 2 = 45,881
This is also equal to:
(D + E + F + G + H + I) = (43,153 + 2,306 + 344 + 47 + 29 + 0) = 45,879
NOTE: Due to real-time issues (the fact that at any given time, some
packets are being processed or queued), the numbers frequently
differ by the number of packets that are in queues.
NOTE: In the case of the EUM, most payloads are sent in response to
directed polls; however, a small number of payloads are sent in
response to random access polls.
The percentage of payloads that are delivered on the first transmission
=
txPayloads10k / (B + C) = 43,153 / 45,879 = 94.1%
Similarly, the percentage of payloads that are not delivered on the first transmission but are
delivered on the second transmission
=
txPayloads20k / (45,879 - 43,153) = 2,306 / 2,726 = 84.6%
The percentage of payloads that are not able to be delivered
= 29 /45,879 = 0.06%
Since there are no broadcast or control payloads, the calculation of the Retransmission Rate
is fairly straightforward:
Retransmission Rate = (1 - desired payloads/actual payloads) x 100
= (1 -
tx Data Payloads / txPayloads) x 100
= (1 - 44,153 / 49,101) x 100
= 10.1%
These calculations are displayed by the “stats summary” command.
11.5 EUM Receive Statistics
Perhaps the most important receive statistic is the Receive Signal Strength Indicator (RSSI),
which provides an indication of the receive signal strength in dBm.
NOTE: Since the EUM can receive packets that are destined for other
EUMs, the EUM receive statistics are not as useful as the CCU
receive statistics. They are useful when the EUM is the only EUM