
User's Manual Part 2


298 APCD-LM043-8.0 (DRAFT C)
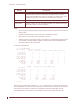
Appendix J: Operating Statistics
CCU Watch Statistics
The CCU includes the <watch> command, which enables you to monitor link statistics for a
single specified EUM.
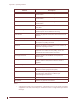
•
watch xx:xx:xx clears the watch statistics memory and starts watching the
specified EUM.
•
watch displays the results of the watch statistics gathering.
While an EUM is being watched, the statistics are incremented only for packets transmitted to
or from the specified EUM.
As part of installing or troubleshooting an EUM, you should “watch” the EUM from the CCU. If
the TxPayloadsFailQueueTooLong statistic increments, then the TCP receive window in the
user’s PC is probably set too high, causing packet discards at the CCU, retransmission on the
network link, and reduced throughput.
NOTE: Long queues at the CCU can also occur due to multiple
concurrent transfers in the process.
You can monitor the MAC statistic “txPayloadsFailQueueTooLong” at the CCU to give an
indication of packet discards due to queue overrun. The MAC statistic
“lastQueueTooLongEUM” at the CCU indicates for which EUM the last packet was discarded.
That EUM can then be “watched” to determine how often discards occur and whether it is a
problem. Some discards may occur simply due to multiple concurrent downloads combined
with heavy system loading. If more than one EUM is having problems, the
“lastQueueTooLongEUM” statistic changes as discards occur.
60:03:3a> watch 60:00:83
Watching 60:00:83
60:03:3a> watch
The EUMID under watch is: 60:30:01
Grade of service: be
RSSI [dBm]: -50
SQ: 6
RNA [dB]: 63
Time since last payload: 0
Input Octets: 1386814542
Input Packets: 20956103
Output Octets: 3395296420
Output Packets: 39582379
Transmitted Packets
No payload : 14192 99.7%
Total : 14229
Transmitted Payloads
1Ok : 34 97.1%
2Ok : 1 2.8%
3Ok : 0 0.0%
4Ok : 0 0.0%
Fail Retry : 0 0.0%
Fail Q Too Long : 0
Fail Timeout : 0
Received and Expected Responses
HCRC Error : 1 0.0%
Directed : 14227 99.9%
Random Access : 0 0.0%