
User's Manual Part 1


50 APCD-LM043-8.0 (DRAFT C)
3: Detailed Description
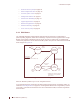
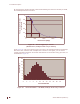
By increasing the number of EUMs to 300 and maintaining the same level of traffic per EUM,
the modelled performance becomes
Figure 28 Net Throughput per Transfer
(300 End users, 60 kbyte HTTP every 2 minutes)
From Figure 28, each of the 300 end users can expect a net throughput better than 300 kbps
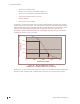
80% of the time, and better than 750 kbps 20% of the time. Once again, you can assess
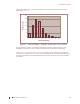
system performance based on the number of EUMs that are associated at any given time, as
is illustrated in Figure 29.
Figure 29 Associated EUMs — 300 EUMs, 60 kbyte HTTP every 2 minutes
0
0.2
0.4
0.6
0.8
1
0 500 1000 1500 2000
Performance (kbps)
Probability that Performance
was Exceeded
0
2
4
6
8
10
12
14
0
2
4
6
8
1
0
1
2
1
4
1
6
1
8
2
0
2
2
Associated EUMs
Frequency (%)