
User's Manual Part 1

98 APCD-LM043-8.0 (DRAFT C)
6: Installation & Diagnostic Tools
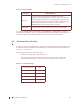
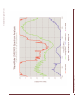
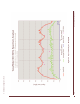
To analyze and interpret the spectral graph, use the following guidelines:
1. If the Average RSSI (green dashed line) is greater than -40dBm, use an external filter
at the output of the EUM or CCU. The EUM/CCU operating frequency should be at
least 10MHz away from any signal that has an Average RSSI greater than -40dBm.
2. If the Max RSSI (red solid line) is more than 15dB above the Average RSSI (green
dashed line), then the usable EUM signal, for normal airlink operation, will be 10 dB
above the Average RSSI.
3. If the Max RSSI (red solid line) is less than 15dB above the Average RSSI (green
dashed line), then the usable EUM signal, for normal airlink operation, will be greater
than the Max RSSI (red solid line).
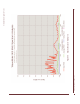
When interpreting the display, it is important to remember that the spectral measurements are
made with the same filters used in normal data reception. Therefore, the signal level
measured at each point includes all interference that will be experienced by the modem when
set to that frequency. It is not correct to “fold-in” energy from adjacent frequencies as this has
already been done. The resulting resolution bandwidth result is approximately 4.2 MHz.
NOTE: Spikes that appear in the spectral output are most likely sampling
artifacts, caused by intermittent transmitters that became inactive
by the time the Spectrum Analyser moved on to neighboring
frequencies.
TIP: During the analysis, the radio link is disabled. If you run a
spectral analysis from a CCU, no data will flow to, or from, any
EUM in that sector during the analysis. Traffic will resume
immediately after the analysis is complete. Similarly, if you run an
analysis from an EUM, no traffic will flow to, or from, that EUM during the
analysis. Other EUMs are not affected. As a result, if you start an analysis
from a telnet session that uses the data link, no results will be reported and
the session will not respond until the analysis is complete. Once it is
complete, all of the results will show up at once.
If the radio link is disabled before the analysis is done (with
radio disable), it will remain
disabled afterwards.
6.5 RSSI, Signal Quality, and Antenna Pointing
The EUM Radio LED and the continuous Receive Signal Strength Indication (RSSI) reading
provide an indication of the level of the signal received from the CCU and an excellent tool for
locating and aligning the EUM antenna. Since the system is based on a polling MAC, there will
always be a signal to receive and monitor from the CCU.