
Technical data

SDA Description
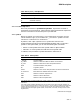
Table SDA–9 (Cont.) SDA Symbols
Symbol Meaning
USP User stack pointer
2
VCB Address of volume control block for mounted device
1
1
The SHOW DEVICE command defines this symbol, if appropriate, to represent information pertinent
to the last displayed device unit. See the description of the SHOW DEVICE command for additional
information.
2
The value of those symbols representing the current SDA process context changes whenever you
issue a command that changes the context (see Section 4). These symbols include the general-purpose
registers (R0 through R11, AP, FP, PC, and SP); the per-process stack pointers (USP, SSP, KSP);
the page table base and length registers (P0BR, P0LR, P1BR, and P1LR); and the processor status
longword (PSL).
When SDA displays an address, it displays that address both in hexadecimal
and as a symbol, if possible. If the address is within FFF
16
of the value of a
symbol, SDA displays the symbol plus the offset from the value of that symbol
to the address. If more than one symbol’s value is within FFF
16
of the address,
SDA displays the symbol whose value is the closest. If no symbols have values
within FFF
16
of the address, SDA displays no symbol. (For an example, see the
description of the SHOW STACK command.)
8 Investigating System Failures
This section discusses how the operating system handles internal errors and
suggests procedures that can aid you in determining the causes of these errors.
To conclude, it illustrates, through detailed analysis of a sample system failure,
how SDA helps you find the causes of operating system problems.
For a complete description of the commands discussed in the sections that follow,
refer to the SDA Commands section.
8.1 General Procedure for Analyzing System Failures
When the operating system detects an internal error so severe that normal
operation cannot continue, it signals a condition known as a fatal bugcheck and
shuts itself down. A specific bugcheck code describes each such error.
To resolve the problem, you must find the reason for the bugcheck. Most failures
are caused by errors in user-written device drivers or other privileged code not
supplied by Compaq. To identify and correct these errors, you need a listing of
the code in question.
Occasionally, a system failure is the result of a hardware failure or an error in
code supplied by Compaq. A hardware failure requires the attention of Compaq
Services. To diagnose an error in code supplied by Compaq, you need listings of
that code, which are available from Compaq on CDROM.
Following are the steps you can take to diagnose an error:
1. Start the search for the error by locating the line of code that signaled the
bugcheck. Invoke SDA and use the SHOW CRASH command to display the
contents of the program counter (PC). The PC contains the address of the
instruction immediately following the instruction that signaled the bugcheck.
2. Use the SHOW STACK command to display the contents of the stack. The
PC often contains an address in the exception handler. This address is the
address of the instruction that signaled the bugcheck, but not the address of
the instruction that caused it. In this case, the address of the instruction that
SDA–19