
Technical data

110
Chapter 6: Compiling and Debugging Parallel Fortran
In addition to the loops, the profile shows the special routines that actually
do the multiprocessing. The mp_simple_sched routine is the synchronizer
and controller. Slave threads wait for work in the routine
mp_slave_wait_for_work. The less time they wait, the more time they work.
This gives a rough estimate of how parallel the program is.
“Parallel Programming Exercise” on page 119 contains several examples of
profiling output and how to use the information it provides.
Debugging Parallel Fortran
This section presents some standard techniques to assist in debugging a
parallel program.
General Debugging Hints
• Debugging a multiprocessed program is much harder than debugging
a single-processor program. For this reason, do as much debugging as
possible on the single-processor version.
• Try to isolate the problem as much as possible. Ideally, try to reduce the
problem to a single C$DOACROSS loop.
• Before debugging a multiprocessed program, change the order of the
iterations on the parallel DO loop on a single-processor version. If the
loop can be multiprocessed, then the iterations can execute in any order
and produce the same answer. If the loop cannot be multiprocessed,
changing the order frequently causes the single-processor version to
fail, and standard single-process debugging techniques can be used to
find the problem.
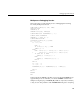
• Once you have narrowed the bug to a single file, use –g –mp_keep to
save debugging information and to save the file containing the
multiprocessed DO loop Fortran code that has been moved to a
subroutine. –mp_keep will store the compiler-generated subroutines in
the following file name:
$TMPDIR/P<user_subroutine_name>_<machine_name><pid>
If you do not set $TMPDIR, /tmp is used.