
User`s guide
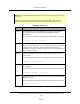


Key(s) Action
Ctrl+X Perform an XSTEP command for the current task from the current
position of the execution pointer.
This command is equivalent to the following system monitor command:
XSTEP debug_task
Ctrl+Z
Perform an SSTEP command for the current task from the current
position of the execution pointer.
This command is equivalent to the following system monitor command:
SSTEP debug_task
Using a Pointing Device With the Debugger
On graphics-based systems, double-clicking on a variable or expression displays the value of
the variable or expression. (If program execution has not progressed to the point where a
variable has been assigned a value, double clicking on the variable may return an undefined
value message.)
Control of Program Execution
While debugging programs, you will want to pause execution at various points to examine the
status of the system (e.g., to display the values of program variables).
The following paragraphs describe how to control execution of the program being debugged.
NOTE: Except for the special debugger commands mentioned below, all the following
techniques can be used even when the program debugger is not in use.
Single-Step Execution
The debugger Ctrl+X command provides a convenient means for having program execution
stop after each instruction is processed. Each time Ctrl+X is entered, a V+ XSTEP command is
processed for the program being debugged.
The debugger Ctrl+Z command is provided to allow you to step across subroutine calls. Each
time Ctrl+Z is entered, an SSTEP command is processed for the program being debugged.
Thus, when the execution pointer is positioned at a CALL or CALLS instruction, typing Ctrl+Z
will cause the entire subroutine to be executed, and execution pauses at the step following
the subroutine call. (Ctrl+Z behaves exactly as Ctrl+X does when the current instruction is
not a subroutine call.)
The Program Debugger
V+Language User's Guide, v17.0
Page 94