DECnet/OSI for VMS Common Trace Facility Use Part Number: AA–PHEBB–TE August 1992 Revision/Update Information: This is a revised manual. Software Version: DECnet/OSI for VMS Version 5.5 Operating System Version: VMS Version 5.
August 1992 The information in this document is subject to change without notice and should not be construed as a commitment by Digital Equipment Corporation. Digital Equipment Corporation assumes no responsibility for any errors that may appear in this document. The software described in this document is furnished under a license and may be used or copied only in accordance with the terms of such license.
Contents Preface . . . . . . . . . . . . . . . . . . . . . . . . . . . . . . . . . . . . . . . . . . . . . . . . . . . . . . . . . . . . vii 1 Introduction to CTF 1.1 1.2 1.3 What Is CTF? . . . . . . . . . . . . . . . . . . . . . . . . . . . . . . . . . . . . . . . . . . . . . . . How Does CTF Work? . . . . . . . . . . . . . . . . . . . . . . . . . . . . . . . . . . . . . . . . Networking Products that Support CTF . . . . . . . . . . . . . . . . . . . . . . . . . . 1–1 1–1 1–2 2 Technical Overview 2.
3.8 3.9 3.9.1 3.9.2 Filtering . . . . . . . . . . . . . . . . . . . . . . . . . . Problems Running CTF . . . . . . . . . . . . . . Loss of Trace Records . . . . . . . . . . . . . Failure to Connect to Remote Servers . . . . . . . . . . . . . . . . . . . . . . . . . . . . . . . . . . . . . . . . . . . . . . . . . . . . . . . . . . . . . . . . . . . . . . . . . . . . . . . . . . . . . . . . . . . . . . . . . . . . 3–12 3–13 3–13 3–13 4 CTF Commands 4.
C VAX WAN Device Driver Tracepoints MODEM_CONNECT LINE DDCMP LINK . . . . . . . . . . HDLC LINK . . . . . . . . . . . LAPB LINK . . . . . . . . . . . . . . . . . . . . . . . . . . . . . . . . . . . . . . . . . . . . . . . . . . . . . . . . . . . . . . . . . . . . . . . . . . . . . . . . . . . . . . . . . . . . . . . . . . . . . . . . . . . . . . . . . . . . . . . . . . . . . . . . . . . . . . . . . . . . . . . . . . . . . . . . . . . . C–2 C–3 C–5 C–6 . . . . . . . . .
C–4 D–1 D–2 D–3 D–4 vi LAPB LINK Trace Events for VAX WAN Device Drivers . . MOP Trace Events for DECnet–VAX . . . . . . . . . . . . . . . . . OSI_TRANSPORT PORT Trace Events for OSI Transport Software . . . . . . . . . . . . . . . . . . . . . . . . . . . . . . . . . . . . . . . ROUTING CIRCUIT Trace Events for DECnet–VAX . . . . . SESSION PORT Trace Events for DECnet–VAX . . . . . . . . ......... ......... C–6 D–2 ......... ......... .........
Preface This manual describes how you use the Common Trace Facility (CTF) utility to collect and analyze protocol data from networking software. Audience This manual is intended for the system or network manager who must carry out problem solving tasks on a DECnet/OSI for VMS network. You should be familiar with: • The VMS operating system • DECnet/OSI for VMS • The networking product(s) that you are tracing.
You should be familiar with the problem solving documentation for the software you are tracing. This documentation contains detailed instructions about how to use CTF to diagnose problems. Conventions Used in This Manual viii Special type in examples indicates text that the system displays or user input. UPPERCASE in a command represent text that you have to enter as shown. lowercase italics indicate variable information that you supply.
1 Introduction to CTF This chapter provides a brief introduction to the Common Trace Facility (CTF). For a more detailed description of the components and functions of CTF, see Chapter 2. 1.1 What Is CTF? CTF is a VMS utility that assists in network problem solving. CTF allows you to collect and display information about specific protocol exchanges between systems in a network.
When data becomes available at a tracepoint that you are tracing, CTF collects that data in the form of a trace record.
2 Technical Overview This chapter provides a brief technical overview of CTF. Section 2.1 describes what tracepoints are, and describes the contents of trace records. Section 2.2 describes the various ways in which CTF can collect trace records from tracepoints. Section 2.3 describes the components of CTF that collect, store, and display trace records. Section 2.4 lists the files that CTF uses. Section 2.5 provides an example of the trace output provided by CTF. 2.
Figure 2–1 Trace Records Protocol header information from protocol layers Trace record data: event code size time tracepoint name context data User data Network protocol data 2.1.1 Local and Remote Tracepoints There are two types of tracepoint: • Local tracepoints are those found within host-based VMS networking products such as VAX P.S.I. • Remote tracepoints are those found within server-based networking products such as the DEC WANrouter 100/500.
2.2.1 Detached Tracing In detached tracing, trace records are collected from one or more tracepoints into an internal CTF buffer, and are then written to a trace file. Note that the trace records in a trace file have not been analyzed; they are still in binary format, and are therefore unsuitable for display or printing. You can use CTF commands to analyze and display the contents of a trace file.
Snapshot tracing is most useful when you can accurately anticipate when the events you want to trace are going to occur; otherwise, the trace information you require may not have been generated when you collect the contents of the buffer, or it may have been overwritten by more recent trace information. Note also that snapshot tracing is less useful when tracing remote tracepoints, since the buffer in this case is on the remote server and holds less trace information than the buffer on the local VMS system.
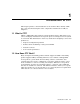
Figure 2–2 Live Tracing on VMS Systems and Remote Servers To screen TRACE utility Trace records from remote server CTF buffer CTF Manager CTF$DCP DEC WANrouter Trace records from local tracepoints VMS VMS System Remote Server 2.3.1 CTF Support on VMS Systems CTF support functions are provided on VMS systems partly by VMS and partly by a process called CTF$DCP.
Figure 2–3 Detached Tracing on VMS Systems and Remote Servers TRACE utility Control Trace server process Trace file Trace records from remote tracepoints CTF buffer CTF Manager CTF$DCP DEC WANrouter Trace records from local tracepoints VMS VMS System Remote Server 2.3.2 CTF Support on Remote Servers CTF support functions on a remote server are provided entirely by the operating system.
2.4 CTF Files Table 2–1 lists the files used by CTF. Table 2–1 CTF Files File Description SYS$SYSTEM: CTF$UI.EXE User interface CTF$SERVER.EXE Detached trace server CTF$DCP.EXE VMS trace record collector process CTF$SECTION.DAT Global section file used as CTF buffer when tracing the local VMS system SYS$LIBRARY: CTF$NAME_TABLE.DAT File containing names of all registered tracepoints and analysis routines.
2.5 An Example of Trace Output This section presents an example of trace output. Although the exact contents of trace output are protocol-specific, there are some general features common to all kinds of trace output. One common feature is the trace output header, which shows: • When the trace was started • When the trace was analyzed All trace output is divided into columns containing the following types of information for each trace record: • The time at which the trace record was generated.
CTF V1.0-00 Page 1 Trace started on 28-JUN-1991 09:28:52.98 Analyzed on 28-JUN-1991 09:31:21.44 Trace File [USER]CTF$TRACE.DAT;1 Output File [USER]TRACE.LIS;1 -----------+----+-----+----------------- Routing Packet Header --------------Time |Evnt|Data | hh mm ss cc| |Size | -----------+----+-----+------------------------------------------------------09:28:53.00|TX | 1492| Type: LAN L2 Hello | Protocol ID: 08, Length: 1B, Version: 01 | Source ID: 08-00-2B-0B-04-28, Holding Time: 30 | Version: V3.0.
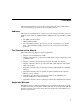
3 Using CTF This chapter describes how to prepare your system for using the Common Trace Facility (CTF), and how to use CTF. 3.1 Introduction Before anyone can use CTF, you must ensure that all CTF-related images have been installed and that adequate system resources are available. Section 3.2 describes the preparations that must be made before CTF can be started on a system. You will require specific rights identifiers in order to use certain CTF commands.
3.2.1 Startup Procedure The CTF SYS$MANAGER:CTF$STARTUP.COM startup procedure is executed during the NET$STARTUP procedure. The startup procedure installs all the CTF-related images. 3.2.
All tracing operations of the CTF on DECnet/OSI end nodes or routers require that the user process hold identifiers in the rights database of the node on which the user is invoking CTF. These identifiers are: Table 3–1 Identifiers in the Rights Database Trace Operation Privilege NET$TraceHeaders can trace message headers on the local node. NET$TraceAll can trace entire messages on the local node. NET$TraceHeadersRemote can trace message headers on remote nodes.
in which case the specified CTF command is executed as soon as TRACE is running. When this command has been executed, you are returned to VMS; the single exception to this rule is the ANALYZE command, which leaves you in the TRACE utility when it has completed (that is, the CTF> prompt will appear). For example: $ TRACE START "ROUTING CIRCUIT LAN-0" runs TRACE and immediately starts detached tracing at the specified tracepoint.
3.5.1 Tracepoint Names A tracepoint is usually associated with a particular network management entity, and has a name that is either identical or similar to the entity name. See the DECnet/OSI Network Management manual for a description of the structure of entity names. For example, the Routing module contains tracepoints for each ROUTING CIRCUIT entity that is created; such a tracepoint would have a name like: "ROUTING CIRCUIT SYN-0" where SYN-0 is the name of a particular ROUTING CIRCUIT entity.
You can use the wildcard characters in two ways: • You can use a wildcard with a partial tracepoint name to specify a number of tracepoints with similar names. For example: "ROUTING CIRCUIT SYN-*" refers to all ROUTING CIRCUIT tracepoints whose name begins with "SYN-". "DDCMP LINK L*K" refers to all DDCMP LINK tracepoints whose name begins with L and ends with K. "CSMACD STATION STAT-?" refers to all CSMACD STATION tracepoints with names of the form STAT-x, where x is a single character.
Since this is detached processing, a trace server process is created to write the collected trace records to a trace file. By default, the name of this trace server process is username$CTF, where username is your user name. You can specify a different name for the trace server process by using the /PROCESS_NAME qualifier of the START command. By default, the trace server process writes trace records to the file CTF$TRACE.DAT in your default directory.
3.5.5 Stopping Tracing To stop the collection of trace records from particular tracepoints, enter the following command: CTF> STOP [tracepoint-name[,...]] For example: CTF> STOP "ROUTING CIRCUIT UNA-0" stops the collection of trace records from the specified tracepoint. If you specify no tracepoint names, all current tracing is stopped. If you specified a trace server process name other than the default, username$CTF, when you started detached tracing (see Section 3.5.
specifies that only trace records with event code RX (receive) are to be displayed. See Section 3.8 for more information about the /FILTER qualifier. • You can use the /NAME qualifier to specify that only trace records from certain tracepoints are to be displayed; for example: CTF> ANALYZE/NAME="SYN-0" specifies that only trace records from tracepoints with the instance name SYN-0 are to be displayed.
By default, trace output is displayed continuously as it arrives. You can use the /NOSCROLL qualifier with ANALYZE to cause output to be displayed a screen at a time; you can then use the BACK and NEXT commands to move backwards and forwards through the output one screen at a time. See the description of the ANALYZE command in Chapter 4 for more information about the qualifiers that you can use while performing live tracing. 3.6.
You can have multiple definitions for one key by defining key states in the DEFINE/KEY command. For a description of how to use key states and the relevant qualifiers of the DCL DEFINE/KEY command, see the description of the DEFINE/KEY command in your VMS documentation. You can use the DELETE/KEY command to delete key definitions made with the DEFINE/KEY command. You can use the SHOW/KEY command to display the current key definitions.
Table 3–2 Default CTF Keys Key CTF Function HELP HELP PF2 HELP KEYPAD DEFAULT PF3 SHOW KEY/ALL KP0 NEXT KP2 START KP3 STOP KP4 ANALYZE/DATA=ASCII/NOSELECT /NODISPLAY/NOTRUNCATE KP6 ANALYZE/DISP=ALL/WIDTH=132 KP7 ANALYZE/DATA=ASCII KP8 ANALYZE/DATA=HEXADECIMAL KP9 ANALYZE/DATA=OCTAL MINUS ANALYZE/DATA=DECIMAL COMMA ANALYZE/TRUNCATE PERIOD BACK NEXT_SCREEN NEXT PREV_SCREEN BACK CTRL/L CLEAR CTRL/W REFRESH GOLD COMMA ANALYZE/NOTRUNCATE GOLD KP0 ANALYZE/SCROLL GOLD KP2
To change the filter associated with a tracepoint, issue another START command with a different filter. For example, if you follow the previous START command with: CTF> START/FILTER=RX "ROUTING CIRCUIT UNA-0" only trace records with event code RX (receive) will be collected. The default value is /NOFILTER, meaning that all trace records generated at the tracepoint are collected.
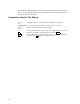
means that the CTF object at the remote server is protected by a user name and password. Either you have failed to supply the user name and password with the START command, or you have specified them incorrectly. • The message: %SYSTEM-F-REJECT, Connect to network object rejected usually means that you have tried to trace a remote server that has been configured as a Phase IV router; CTF is supported only on servers that have been configured as DECnet/OSI for VMS routers.
4 CTF Commands This chapter provides a detailed description of each of the CTF commands and its qualifiers. Table 4–1 lists the available CTF commands. Table 4–1 Summary of CTF Commands Command Description ANALYZE Displays the trace records in a trace file, and specifies the format of this display (for both live and detached tracing). ATTACH Transfers control to another process. BACK Displays the previous screen of trace data. CLEAR Clears the screen of trace data.
ANALYZE ANALYZE The ANALYZE command formats and displays the contents of a trace file. The command is also used to specify the format in which trace data is displayed, either during live tracing or when the contents of a trace file are displayed. Format ANALYZE [file-spec] [/qualifiers] Parameters file-spec Specifies the name of the trace file to be displayed. The default is the file CTF$TRACE.DAT in your default directory. You cannot specify this parameter if you are performing live tracing.
ANALYZE /DISPLAY=(field,...) /NODISPLAY Specifies which fields of a trace record (other than the protocol data itself) are displayed. The fields that can be displayed are: [NO]ALL [NO]CONTEXT [NO]EVENT [NO]FUNCTION_CODE [NO]NAME [NO]SIZE [NO]STATUS [NO]TIME All the fields shown below are displayed. Tracepoint-specific information The event code The tracepoint-specific function code of the operation being traced. The name of the tracepoint from which the trace record was collected.
ANALYZE /PROTOCOL=(protocol-identifier,...) /NOPROTOCOL Specifies the type of analysis performed on each trace record. The protocol data in each trace record is analyzed for each of the protocols listed in the /PROTOCOL qualifier, in the order in which they are specified. If you do not specify this qualifier, only the protocol data supplied at the protocol level of the originating tracepoint is analyzed; protocol data from higher levels is displayed, unanalyzed, as user data.
ANALYZE Description The ANALYZE command allows you to: • Display the contents of a trace file, and specify the format of the display. • Change the format of the display during live tracing. If you issue the ANALYZE command while displaying a trace file, and you do not specify a filename, the qualifiers you use will be applied to the trace file being displayed. You may not ANALYZE a trace file during live tracing, but you may use the ANALYZE command to alter the format of the display for live tracing.
ATTACH ATTACH The ATTACH command transfers control to the specified process. Format ATTACH [process-name] [/qualifiers] Parameters process-name Specifies the name of a parent process or spawned sub-process to which control passes. The process must already exist, must be part of your current job, and must share the same input stream as your current process. However, the process cannot be your current process or a sub-process created with the SPAWN command using the /NOWAIT qualifier.
BACK BACK The BACK command displays the previous screen of trace data. Format BACK Parameters None Description If you are displaying the contents of a trace file, the BACK command puts the screen into scroll mode, in which you can display trace data one screen at a time using the NEXT and BACK commands. Each subsequent BACK command displays the previous screen of trace data.
CLEAR CLEAR The CLEAR command clears the screen of trace data. Format CLEAR Parameters None Description See also the REFRESH command.
COLLECT COLLECT The COLLECT command takes a snapshot of current tracing activity. Format COLLECT [/qualifier] Parameters None Qualifiers /PROCESS_NAME Specifies the name of the trace server process that is to collect the data. This must be the same process that you specify in the /PROCESS_NAME qualifier in the START/NOCOLLECT command that you issued to start snapshot tracing. If you do not specify a process name, then CTF will use the process named username$CTF.
DEFINE/KEY DEFINE/KEY The DEFINE/KEY command associates a string with a particular key on your keyboard. Format DEFINE/KEY key-name string [/qualifiers] Parameters key-name Specifies the name of the key that you are defining. See Table 3–2 for a list of the keys that CTF defines. string Specifies the character string to be processed when you press the specified key. Enclose the string in double quotes to preserve spaces and lower case characters.
DEFINE/KEY Description See Table 3–2 for a list of the default key definitions. See also SHOW KEY and DELETE/KEY. Examples CTF> DEFINE/KEY KP2 "START/LIVE/NOCOLLECT"/TERMINATE causes KP2 to start live snapshot tracing. CTF> DEFINE/KEY KP2/IF_STATE="GOLD" "START/NOCOLLECT"/TERMINATE causes GOLD KP2 to start detached snapshot tracing.
DELETE/KEY DELETE/KEY The DELETE/KEY command deletes key definitions that have been defined by the DEFINE/KEY command. Format DELETE/KEY key-name [/qualifier] Parameters key-name Specifies the name of the key whose definition is to be deleted. See Table 3–2 in the description of the DEFINE/KEY command for a list of the key names that CTF supports. Qualifiers /STATE=(state,...) Specifies the name of the state(s) for which the key definition is to be deleted. The default is the current state.
EXIT EXIT The EXIT command stops the TRACE utility and returns you to VMS. Format EXIT Parameters None Description If you are performing live tracing, all trace record collection will stop. If you are performing detached tracing, however, collection will continue unless you explicitly stop it using the STOP command. Ctrl/Z has the same effect as the EXIT command.
HELP HELP The HELP command displays information about CTF commands. Format HELP [command-name] Parameters command-name Specifies the command for which help is required. Description The HELP command displays information about the specified CTF command. You can request additional information on command parameters and qualifiers by specifying the name of a topic in response to the Topic? prompt. If you do not specify a command name, HELP lists the commands and topics for which you can request help.
REFRESH REFRESH The REFRESH command redraws the screen. Format REFRESH Parameters none Description Ctrl/W has the same effect as the REFRESH command.
SHOW KEY SHOW KEY The SHOW KEY command displays the current key definitions for your keyboard. Format SHOW KEY [key-name] [/qualifiers] Parameters key-name Specifies the name of the key whose definition is to be displayed. See Table 3–2 in the description of the DEFINE/KEY command for a list of the key names supported by CTF. If you do not specify a key-name, you must specify the /ALL qualifier. Qualifiers /ALL Displays all the key definitions for your keyboard.
SPAWN SPAWN The SPAWN command creates a sub-process of the current process. Format SPAWN [/qualifiers] [command-string] Parameters command-string Specifies a command string of up to 131 characters that is to be executed in the context of the created sub-process. When the command completes, the sub-process terminates and control returns to the parent process. If you do not specify a command string, a sub-process is created and remains until you log out.
SPAWN Examples CTF> SPAWN "SHOW SYSTEM" spawns a sub-process in which a SHOW SYSTEM command is executed, after which control returns to the parent process. CTF> SPAWN /INPUT=CMDS.COM spawns a sub-process and executes the DCL commands in CMDS.COM, after which control returns to the parent process. CTF> SPAWN /INPUT=CMDS.COM/OUTPUT=CMDS_OUT.LIS/NOWAIT also executes the DCL commands in CMDS.COM, but returns control immediately to the parent process without waiting for the spawned sub-process to complete.
START START The START command starts tracing on one or more specified tracepoints. Format START [node-name["user-name password"]::] "tracepoint-name",... [/qualifiers] Parameters node-name Specifies the node name of a remote server. You must specify a node name when starting a remote tracepoint. user-name Specifies the user name associated with the remote CTF object. You must specify this user name if the remote CTF object is protected.
START /VERSION_LIMIT=n Specifies the number of versions of the trace file to keep. When this many versions have been created, each new version of the trace file causes the oldest current version to be deleted. The default is 10. Live Tracing /BRIEF Specifies that a single-line analysis of the protocol data in each trace record is displayed. The default is /BRIEF. This qualifier is effective only if the relevant protocol analysis routines support abbreviated analysis of protocol data. /DISPLAY=(field,...
START /PROTOCOL=(protocol-identifier,...) /NOPROTOCOL Specifies the type of analysis performed on each trace record. The protocol data in each trace record is analyzed for each of the protocols listed in the /PROTOCOL qualifier, in the order in which they are specified. If you do not specify this qualifier, only the protocol data supplied at the protocol level of the originating tracepoint is analyzed; protocol data from lower levels is displayed, unanalyzed, as user data.
START /FILTER=(event-code,...) /NOFILTER Specifies a filter for trace records. A trace record is collected only if its event code is one of those specified in the filter. See the appendixes to this manual for a list of the event codes supported by each tracepoint. This value overrides the current filter, if any. You cannot specify this qualifier with /SELECT. The default is /NOFILTER, meaning that all trace records are collected.
START CTF> START "ROUTING CIRCUIT UNA-1" /OUT=UNA-1/PROC=UNA1PROC starts detached tracing at the specified local tracepoint. Trace records are written to the file UNA-1.DAT, and the name of the trace server process that is created to collect trace records is UNA1PROC. CTF> START "ROUTING CIRCUIT UNA-3" /LIVE/FULL starts live tracing at the specified local tracepoint. A full analysis of each trace record is displayed on your screen.
STOP STOP The STOP command stops collection at one or more specified tracepoints. Format STOP ["tracepoint-name",...] [/qualifier] Parameters tracepoint-name Specifies the tracepoint(s) at which collection is to be stopped. Qualifiers /PROCESS_NAME=process-name Specifies the process name of the trace server process associated with the specified tracepoints. This must be the process name specified in the /PROCESS_NAME qualifier of the START command that started the tracing.
A DEC WANrouter 100/500 Tracepoints This appendix describes the tracepoints provided by DEC WANrouter 100/500.
MODEM_CONNECT LINE MODEM_CONNECT LINE Format node-name"user-name password"::"MODEM_CONNECT LINE line-name" node-name Specifies the name of the router node. user-name Specifies the user name associated with the remote CTF object. password Specifies the password associated with the remote CTF object. line-name Specifies the name of the MODEM CONNECT LINE entity to be traced. Description This traces DEC STD52 state changes and data PDU’s transmitted on the specified Modem Connect line.
DDCMP LINK DDCMP LINK Format node-name"user-name password"::"DDCMP LINK link-name" node-name Specifies the name of the router node. user-name Specifies the user name associated with the remote CTF object. password Specifies the password associated with the remote CTF object. link-name Specifies the name of the DDCMP LINK entity to be traced. Description This traces all data link PDUs transmitted and received by the DDCMP module on the specified link.
HDLC LINK HDLC LINK Format node-name"user-name password"::"HDLC LINK link-name" node-name Specifies the name of the router node. user-name Specifies the user name associated with the remote CTF object. password Specifies the password associated with the remote CTF object. link-name Specifies the name of the HDCL LINK entity to be traced. Description This traces HDLC frames on the specified link. The default analysis of this tracepoint will analyze the HDLC frame header.
LAPB LINK LAPB LINK Format node-name"user-name password"::"LAPB LINK link-name" node-name Specifies the name of the router node. user-name Specifies the user name associated with the remote CTF object. password Specifies the password associated with the remote CTF object. link-name Specifies the name ofthe LAPB LINK entity to be traced. Description This traces all data link PDUs transmitted and received by the specified LABP LINK entity. Table A–4 lists the events that are recognized at this tracepoint.
CSMA-CD STATION CSMA-CD STATION Format node-name"user-name password"::"CSMA-CD STATION station-name" node-name Specifies the name of the router node. user-name Specifies the user name associated with the remote CTF object. password Specifies the password associated with the remote CTF object. station-name Specifies the name of the CSMACD STATION entity to be traced. Description This traces the complete 802.3 frames or the ETHERNET frame, decoding the 802.3 and 802.2 headers where applicable.
CSMA-CD STATION Example $ TRACE START mynode"myname mypw"::"CSMA-CD STATION csmacd-0"/LIVE produces the following output: -----------+----+-----+<-----802.3 Frame Header------>+<-----802.2 Frame Header----->+ Time |Evnt|Data | Destination| Source |Len- |Dst Src C P Type N N | hh mm ss cc| |Size | Address | Address |gth |SAP SAP R F R/S R/S | -----------+----+-----+<----------------------------->+<-----------------------------+ 13:16:18.95|TX | 40|09002B000004|AA0004005606| 26| FE FE C UI | 13:16:18.
CSMA-CD PORT CSMA-CD PORT Format node-name"user-name password"::"CSMA-CD PORT port-name" node-name Specifies the name of the router node. user-name Specifies the user name associated with the remote CTF object. password Specifies the password associated with the remote CTF object. port-name Specifies the name of the CSMACD PORT entity to be traced. Description This traces the DATA part of ETHERNET frames and the 802.2 LLC PDU part of 802.3 frames. Table A–6 lists the events recognized at this tracepoint.
X25L3 DTE X25L3 DTE Format node-name"user-name password"::"X25L3 DTE DTE-name" node-name Specifies the node name of a remote server. user-name Specifies the user name associated with the remote CTF object. password Specifies the password associated with the remote CTF object. DTE-name Specifies the name of the X25 PROTOCOL DTE entity to be traced. Description This traces all X25 packet-level PDUs transmitted and received by the X25 PROTOCOL Module on the specified DTE.
X25L3 CIRCUIT X25L3 CIRCUIT Format node-name"user-name password"::"X25L3 CIRCUIT *" node-name Specifies the node name of a remote server. user-name Specifies the user name associated with the remote CTF object. password Specifies the password associated with the remote CTF object. Description This tracepoint traces all X25 packet level PDUs transmitted and received by the X25 Protocol Module. Tracing can be enabled for all circuits only. Table A–8 lists the events that are recognized at this tracepoint.
ROUTING CIRCUIT ROUTING CIRCUIT Format node-name"user-name password"::"ROUTING CIRCUIT circuit-name" node-name Specifies the name of the router node. user-name Specifies the user name associated with the remote CTF object. password Specifies the password associated with the remote CTF object. circuit-name Specifies the name of the ROUTING CIRCUIT entity to be traced. Description This traces all network-layer PDUs transmitted and received by the specified circuit.
ROUTING CIRCUIT -----------+----+-----+----------------- Routing Packet Header ---------------Time |Evnt|Data | hh mm ss cc| |Size | -----------+----+-----+-------------------------------------------------------09:28:53.00|TX | 1492| Type: LAN L2 Hello **1** | Protocol ID: 08, Length: 1B, Version: 01 | Source ID: 08-00-2B-0B-04-28, Holding Time: 30 | Version: V3.0.0, Segment Length: 05D4 | Circuit: Level 2, L1 Algorithm: N/A, L2 Algorithm: LS | Priority: 64, LAN ID: 08-00-2B-0B-04-A6.
ROUTING CIRCUIT 09:29:15.52|TX | 09:29:15.
NSP PORT NSP PORT Format node-name"user-name password"::"NSP PORT port-reference" node-name Specifies the name of the router node. user-name Specifies the user name associated with the remote CTF object. password Specifies the password associated with the remote CTF object. port-reference Specifies the 4-digit local reference number of the NSP PORT entity to be traced. Description This traces all PDUs transmitted and received by the specified port.
NSP PORT -----------+----+-----+<--------------------NSP Frame------------------>+ Time |Evnt|Data |Msg Data Other Segnum Drc Flow| hh mm ss cc| |Size |Type Dest Source C Numb Numb D Numb Irc Cntl| -----------+----+-----+<----------------------------------------------->+ 16:15:30.68|RX | 7|Dack 9731 8199 8 | 16:15:31.66|TX | 292|Data 8199 9731 2 9 | 16:15:31.68|RX | 7|Dack 9731 8199 9 | 16:15:32.66|TX | 292|Data 8199 9731 2 10 | 16:15:32.68|RX | 7|Dack 9731 8199 10 | 16:15:32.
B VAX P.S.I. Tracepoints This appendix describes the tracepoints provided by VAX P.S.I. for DECnet/OSI for VMS. These tracepoints are (starting from the lowest protocol level): LAPB LINK LLC2 SAP LINK X25L3 DTE X25L3 CIRCUIT X25GAP CIRCUIT VAX P.S.I.
LAPB LINK LAPB LINK Format "LAPB LINK link-name" link-name Specifies the name of the LAPB LINK entity to be traced. Description This traces all data link PDUs transmitted and received by the specified LABP LINK entity. Table B–1 lists the events that are recognized at this tracepoint. Table B–1 LAPB LINK Trace Events for VAX P.S.I.
LLC2 SAP LINK LLC2 SAP LINK Format "LLC2 SAP sap-name LINK link-name" sap-name Specifies the name of the SAP whose link is to be traced. link-name Specifies the name of the SAP LINK entity to be traced. Description This traces all data-link PDUs transmitted and received by the LLC2 Module on the specified link. Table B–2 lists the events that are recognized at this tracepoint. Table B–2 LLC2 SAP LINK Trace Events for VAX P.S.I.
X25L3 DTE X25L3 DTE Format "X25L3 DTE DTE-name" DTE-name Specifies the name of the X25 PROTOCOL DTE entity to be traced. Description This traces all X25 packet-level PDUs transmitted and received by the X25 PROTOCOL Module on the specified DTE. Table B–3 lists the events that are recognized at this tracepoint. Table B–3 X.25 DTE Trace Events for VAX P.S.I.
X25L3 DTE -----------+----+-----+<--------Packet-------->+ Time |Evnt|Data |Chn Q Type P P | hh mm ss cc| |Size | M R/S R/S | -----------+----+-----+<---------------------->+ 14:56:07.30|TX | 13|001 CALL |Called DTE 10210 | Calling DTE 102 | Data 01 00 00 00 | | 14:56:08.25|RX | 3|001 CALLC | 14:56:08.27|RX | 14|001Q DATA 0/0 | 14:56:08.28|RX | 4|001 DATA 0/1 | 14:56:08.36|TX | 3|001 RR 1/ | 14:56:08.67|TX | 3|001 RR 2/ | 14:56:08.80|TX | 14|001Q DATA 2/0 | 14:56:08.85|RX | 3|001 RR 1/ | 14:56:09.
X25L3 CIRCUIT X25L3 CIRCUIT Format "X25L3 CIRCUIT *" Description This tracepoint traces all X25 packet level PDUs transmitted and received by the X25 Protocol Module. Tracing can be enabled for all circuits only. Table B–4 lists the events that are recognized at this tracepoint. Table B–4 X.25L3 CIRCUIT Trace Events for VAX P.S.I.
X25GAP CIRCUIT X25GAP CIRCUIT Format "X25GAP CIRCUIT *" Description This tracepoint traces all X25 GAP PDUs transmitted and received by the X25 Server and X25 Client Modules. Tracing can be enabled for all circuits only. Table B–5 lists the events that are recognized at this tracepoint. Table B–5 X25GAP CIRCUIT Trace Events for VAX P.S.I.
C VAX WAN Device Driver Tracepoints This appendix describes the tracepoints provided by VAX WAN device drivers for DECnet/OSI for VMS.
MODEM_CONNECT LINE MODEM_CONNECT LINE Format "MODEM_CONNECT LINE line-name" line-name Specifies the name of the MODEM CONNECT LINE entity to be traced. Description This traces DEC STD52 state changes and data PDU’s transmitted on the specified Modem Connect line. Table C–1 lists the events that are recognized at this tracepoint.
DDCMP LINK DDCMP LINK Format "DDCMP LINK link-name" link-name Specifies the name of the DDCMP LINK entity to be traced. Description This traces all data link PDUs transmitted and received by the DDCMP module on the specified link. Table C–2 lists the events recognized at this tracepoint.
DDCMP LINK Example $ TRACE START "DDCMP LINK $qlnk-dsv-0-0"/LIVE produces the following output: -----------+----+-----+<--------DDCMP Frame-------->+ Time |Evnt|Data | Typ QS Res Num Ctl Adr Count| hh mm ss cc| |Size | | -----------+----+-----+<--------------------------->+ 09:28:30.81|RX | 16| DAT S 241 242 1 8| 09:28:30.82|TX | 16| DAT S 242 243 1 8| 09:28:30.82|TX | 16| DAT S 242 244 1 8| 09:28:30.84|TX | 16| DAT S 242 245 1 8| 09:28:30.85|RX | 16| DAT S 242 243 1 8| 09:28:30.
HDLC LINK HDLC LINK Format "HDLC LINK link-name" link-name Specifies the name of the HDLC LINK entity to be traced. Description This traces HDLC frames on the specified link. The default analysis of this tracepoint will analyze the HDLC frame header. Table C–3 lists the events recognized at this tracepoint.
LAPB LINK LAPB LINK Format "LAPB LINK link-name" link-name Specifies the name of the LAPB LINK entity to be traced. Description This traces all data link PDUs transmitted and received by the specified LAPB LINK entity. Table C–4 lists the events that are recognized at this tracepoint.
D DECnet/OSI for VMS Tracepoints This appendix describes the tracepoints provided by DECnet/OSI for VMS.
MOP MOP Format "MOP CIRCUIT circuit-name" circuit-name Specifies the name of the MOP CIRCUIT entity to be traced. Description This traces all the PDUs passed between MOP and the datalink drivers over the specified circuit. Table D–1 lists the events that are recognized at this tracepoint. Table D–1 MOP Trace Events for DECnet–VAX Trace Event Description RX TX Receive Transmit Note that ANALYZE/FULL will interpret the message type and all parameters.
MOP Example $ TRACE/ANALYZE/PROTOCOL=MOP/FULL CTF$TRACE.DAT produces the following output: CTF V1.0-00 Page 1 Trace started on 6-FEB-1992 15:57:45.03 Analyzed on 6-FEB-1992 16:52:36.36 Trace File CTF$TRACE.DAT;2 Output File CTF$MOP_CIRCUIT.
NSP Transport NSP Transport Format "NSP PORT port-name" port-name Specifies the name of the NSP port entity to be traced. Description This tracepoint captures receive data after the PDU from Routing has been analyzed to determine what port it belongs to. Transmit data is captured just before it is passed to Routing. Format "NSP GLOBAL globe-name" globe-name Specifies the wildcard "*".
NSP Transport Example $ TRACE/ANALYZE/PROTOCOL=NSPTP/FULL CTF$TRACE.DAT produces the following output: CTF V1.0-00 Page 1 Trace started on 6-FEB-1992 15:48:01.90 Analyzed on 6-FEB-1992 15:51:46.07 Trace File CTF$TRACE.DAT;1 Output File CTF$NSP_PORT.
OSI_TRANSPORT PORT OSI_TRANSPORT PORT Format "OSI_TRANSPORT PORT name" name Specifies the name of the OSI TRANSPORT PORT entity to be traced. Description This traces all PDUs transmitted and received by the OSI module at the specified port. Table D–2 lists the events that are recognized at this tracepoint.
OSI_TRANSPORT PORT Example $ TRACE ANAL CTF$TRACE.DAT;7/PROT=OSI_TRANSPORT/OUT=TRACE_FULL.LIS/FU produces the following output: CTF V1.0-00 Page 1 Trace started on 15-NOV-1990 12:51:39.87 Analyzed on 15-NOV-1990 12:52:51.54 Trace File [TEST]CTF$TRACE.DAT;7 Output File TRACE_FULL.LIS;1 -----------+----+-----+<---------------------Transport-Header-----------------------> Time |Evnt|Data | Data hh mm ss cc| |Size | -----------+----+-----+<------------------------------------------------------------> 12:51:39.
OSI_TRANSPORT PORT 12:51:40.13|Rx | || || 51|| || || || || || || || Type: DC Li: 05 Source Ref: 115F Destination Ref: 020E TC_id : 020E Class 4, Extended Remote Nsap: 49004108002B079D7321 TRACE ANAL CTF$TRACE.DAT;7/PROT=OSI_TRANSPORT/OUT=TRACE_FULL.
ROUTING CIRCUIT ROUTING CIRCUIT Format "ROUTING CIRCUIT circuit-name" circuit-name Specifies the name of the ROUTING CIRCUIT entity to be traced. Description This traces all network-layer PDUs transmitted and received on the specified circuit. Note that it is not possible to trace circuits whose instance identifier is a Binary or Quoted Simplename. Table D–3 lists the events that are recognized at this tracepoint.
ROUTING CIRCUIT Example $ TRACE/START/PROTOCOL=ROUTING produces the following output: CTF V1.0-00 Page 1 Trace started on 21-FEB-1992 16:38:17.49 Analyzed on 21-FEB-1992 16:41:43.05 Trace File DISK$:[MGR]LAN0.DAT;1 Output File DISK$:[MGR]LAN0.LIS;2 -----------+----+-----+----------------- Routing Packet Header ----------------+-------------------Time |Evnt|Data | |Data hh mm ss cc| |Size | | -----------+----+-----+--------------------------------------------------------+-------------------16:38:19.
Session Control Session Control Format "SESSION PORT port-name" port-name Specifies the name of the SESSION PORT entity to be traced. Description This tracepoint shows the address towers used when establishing session connections, as well as the state transitions that the specified port undergoes.
Session Control Example $ TRACE/ANALYZE/PROTOCOL=SCL/FULL CTF$TRACE.DAT produces the following output: CTF V1.0-00 Page 1 Trace started on 6-FEB-1992 15:39:12.04 Analyzed on 6-FEB-1992 15:53:06.67 Trace File [MILLBRANDT]CTF$TRACE.DAT;1 Output File CTF$SESSION_PORT.
Index B CTF commands (cont’d) SHOW KEY, 4–16 SPAWN, 4–17 START, 3–2, 3–6, 3–7, 4–19 STOP, 3–2, 3–8, 4–24 summary, 4–1 CTF support, 2–4 on remote servers, 2–6 on VMS systems, 2–5 BACK command, 3–10, 4–7 Buffers, 2–4 D A Analysis, 4–2 of trace records, 1–2 ANALYZE command, 3–8, 3–10, 4–2 ATTACH command, 4–6 C CLEAR command, 4–8 COLLECT command, 4–9 Collecting trace records, 2–2 detached tracing, 2–3, 3–4, 3–6 live tracing, 2–3, 3–4, 3–7, 3–8 snapshot tracing, 2–3, 3–7 CTF buffers, 2–3, 3–13 files, 2–7 f
L /LIVE qualifier, 3–7 Live tracing, 2–3, 3–4, 3–8 starting, 3–7 stopping, 3–8 Local tracepoints, 2–2 Loss of trace records, 3–13 N /NAME qualifier, 3–9 NETTRACE utility, 3–4 NEXT command, 3–10 /NOCOLLECT qualifier, 3–7 /NOSCROLL qualifier, 3–10 P Problems running CTF, 3–13 failure to connect to remote systems, 3–13 loss of trace records, 3–13 /PROTOCOL qualifier, 3–9 R REFRESH command, 4–15 Remote tracepoints, 2–2 names, 3–5 Running TRACE, 3–3 S /SELECT qualifier, 3–9 SHOW KEY command, 4–16 Snapshot fa