
User`s manual


bar second. Figure 6.2 shows the relation between the FOV,
-
the inspection direction, and the Line Image.
Figure 8.1
View Image Ufsplay of the Almlng Target
QD
(LineImage
Black bar
Black-gray-black
White White
White
Em
t) First edge: 22.52
!I1 Last edge: w
-
i!!!Q
1-D Spatial tkasurement
Xs = first edge & last edge
-
6-2
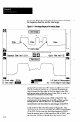
Look closely at the lower right comer of Figure 6.1, above.
The SLS analysis function is I-D Spatial Measurement,
which locates the fist edge of the frst object in the FOV
and the last edge of the last object in the FOV. A small “x”
identifies the location of each edge.
The Line Image extends across 100% of the FOV. The
starting point of the inspection is the 0% of FOV, and the
ending point is 100% of the FOV. All locations and
measurements are thus stated as percentages of the FOV.
-
Look closely at the lower left comer of Figure 6.1. The
locations of the first and last edges are stated as percentages
of the FOV. In this case, the first edge location is 22.5%
from the starting point of the inspection (0% of FOV), and
the fart edge location is 68.0% from the starting point.