
User`s manual


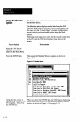


Verify that the cursor is
highlighting “‘X Bar and R
and Histogram,” then press
the ENTER key.
Figure3.W ChmtSeMionandSeiupMenu
K Bar and Histogram -
X and Histogram
X and Sideways Histogram
Turn Logging On
Log File Cowersion
SPC Log Report
Delete SPC Log
Saue SPC Setup Configuration
Results logging is Off.
When you press the ENTER key, the software begins
initializing the SPC display screen, then begins displaying
the SPC data as shown in Figure 3.17 on page 3-16.
The SPC data display in this example includes a histogram
and graphic display of results data averages (X Bar), and a
graphic display of range data (R). Basic statistical data
appear under each histogram. This is one of several chart
displays that am available for SPC operations.
Chapter 8, Statistical Process Control, provides full details
of the SPC menus, screens, and data displays.
This completes the “Getting Started’ procedure for using
the SPC option.
Continue with Summary of CSS Procedures, next.
3-15