
User`s manual


-
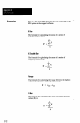
Control Limits: Individuals Charts
The formulas for calculating the control limits for
individuals charts are:
UCL, = x+ ya
LCL, = x-y7
Note: y defaults to 3, but you can change it to
any value from 1 to 5.
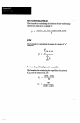
Control Limits: p Charts
The formulas for calculating the control limits for p charts
WC
UCL, = p + 3
J
Pu -P-l
-
-
n
LCL, = p - 3
J
PI1 -PI
-
n
C-6