
User`s manual


Glossary
Here is a list of terms used in this manual and/or in
statistical process control.
Assignable cause - A non-random cause of variation in a
process resulting from an identifiable, and therefore
correctable, source (see Common cause). Also called
special cause.
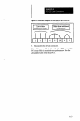
Cell - For a sample based on a continuous variable, a cell is
an interval into which individual data points are grouped.
The full range of the variable is usually broken into
intervals of equal size, and the number of points in each
cell totalled. These intervals (cells) make up a frequency
distribution called a histogram. This greatly reduces the
amount of information that must be dealt with, as opposed
to treating each element (data point) individually.
Centerline - For control charts, the centerline is the
horizontal lie marking the center of the chart, usually
indicating the grand average of the quantity being charted.
Common cause - A random cause of variation in a process
resulting from an unidentifiable source (see Assignable
cause). Also called chance, normal, and system
cause.
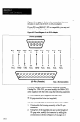
Control limits - Two calculated values, appearing as upper
and lower control limit lines on a control chart, that indicate
the extent of the variation to be expected from a process on
the basis of “common” causes of variation. The process is
“in control” so long as the values lie between the two
control limits.
Control chart - A statistical tool that can be used to
monitor the stability of a process and indicate whether the
process is “in control.” A control chart plots statistical data
based on measurements of the process, and it includes a
center line and an upper and lower control limit line.
Statistical data displayed in a control chart can identify the
presence of “assignable” causes (compared to “common”
or chance causes) of variations in a process, and can thus
identify whether the process is “out of control” and in need
of adjustment.
CSS -The SLS Configuration Support Software.
Histogram - A frequency distribution diagram that uses
several bars or “cells” to indicate equal intervals within an
overall range of vahres. The length or height of each cell
indicates the number of entries within its interval. Together,