
User`s manual
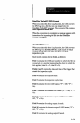


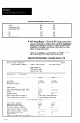


Figure 8.32 Histogram Report p of 2)
___-__-_--_-_-__--______________________----------------------------------------
nay 14, 1991 - 08:15:16 Page 2
Allen-Bradley Company -- Smart Linear Sensor --
Eistcqram Report
Ajax Widget Co.
1234 Main Street
Center City, OSA
________________________________________----------------------------------------
DeSCriptiOU : Part Width
Chart Description: Object center
Low value : 0.00000
Eigh Value : 100.00000
rrhimum: 59.58 l4aximum: 60.63
wean: 60.12
Standard Deviation: 0.18
Histogram Cells:
Cell" Low High Number in Cell
________________________________________---------------------
1 59.58 59.61 2
2 59.63 59.68 4
3 59.71 59.76 9
4 59.78 59.83 30
5 59.85 59.90 70
6 59.93 59.98 111
7
60.00 60.05 154
8 60.07 60.12 174
9
60.15 60.20 133
10
60.22 60.27 118
11
60.29 60.34
92
12 60.37 60.42 54
13 60.44 60.49 32
14 60.51
60.56 13
15 60.59
60.63
6
8-68