
User`s manual


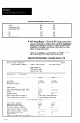


Figure 8.31 Histogram Report (I of 2)
____-__-____________*-----------------------------------------------------------
way 14, 1991 - 08:45:11 page 1
Allen-Bradley Company --
smart Idnear Sensor --
Histogram Report
Ajax Widget Co.
1234 Hain street
center city, USA
Description : Part Width
Chart Description: Object width
Low Wlue : 0.00000
Bigh Value : 100.00000
ISI,: 67.69
USIA: 69.69
Minimum: 67.50
waximum: 69.60
wan: 68.52 Standard Deviation: 0.35
Histogram Cells :
Cells Low High
Number in Cell
__-----.____---_________________________---------------------
1
67.50 67.59
1
2
67.62 67.74
3
3 67.77
67.89
22
4
67.91 68.03
48
5
68.06
68.18
112
6
68.21
68.30 114
7
68.33 68.45
169
8
68.47
68.60
139
9
68.62 68.74
144
10
68.77 68.89
95
11
68.91 69.01
64
12
69.04
69.16
52
13
69.18
69.30
25
14
69.33 69.45
10
15
69.47
69.60
4
8-67