
User`s manual


-
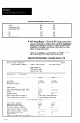
l Histogram Report - This report, like the Statistics
Report, is based on inspection results that were saved
during SPC operations using the currently highlighted
setup record. The report can originate from run-only
SPC operations, or from SPC operations based on the
short or long setup screen.
The histogram report (Figure 8.31, page 8-67, and
Figure 8.32, page8-68) contains two pages. Each page
contains a horizontal “histogram” consistine of “*”
(asterisk) characters, and a Able showing &ll contents.
Chart A data appear on “Page 1” of the report; chart B
data appear on “Page 2.”
The “*” histograms provide a visual indication of the
relative distribution of data point entries in each cell.
The tables show the range of values within each cell and
the number of entries in each cell.
8-66