
User`s manual


-
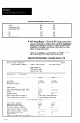
Figure 8.2s SKi statlsnes Report (2 of 2)
B Bar
Calculated LCLs
Calculated UCLs
CP
CPk
Cr
Estimated sigma
0.95
WA
0.79
N/A
1.05
WA
0.36 0.18
l SPC Setup Report-This is an SPC setup record, and it
always contains the contents of the currently highlighted
setup record, using the Long SPC Setup Screen format,
regardless of whether you access it from the run-only,
short, or long setup menu.
Figure 8.29 (page 864) and Figure 8.30 (page 8-65)
show the entire SPC setup report in two parts.
Figure W9 SPCSetup Repott Long Setup Screen (I of 2)
----------______________________________--------*-------------------------------
my 14, 1991 - 08:45:45 Page 1
Allen-Bradley Company -- Smart Linear Sensor -- WC setup Report
Ajax Widget Co.
1234 Main Street
Center City, USA
DeLiCriptiOn
: Part Width
________________________________________-- Chart I\ _________ CJ,afl B _______
Low Value 0.00000 0.00000
BFqh Yallie 100.00000 100.00000
Decimal Precision 2 2
Sample size
5 1
Lover Specification Limit (LSL) 67.69
Upper Specification Limit (EL)
69.69
Target
68.50
Display chart?
Ye8 Yes
Chart selection for Chart A
X Bar and R and Histogram
Chart selection for Chart B
X and Sideways Histogram
__________________________
x Of x Bar chart setup ------------._---__-..-
Lower chart Boundary
Upper Chart Boundary
Display control limits?
Use fired control limits?
Lover Control Limit X (LCLX)
Upper Control Limit X (CCL*)
Use fixed center line?
67.91 59.56
69.06 60.71
Yes
Ye8
NO NO
NO
NO
Center Line
Number of sigma units for limits
3
3