
User`s manual


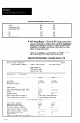


Figure 8.27 spc sfatktics Report (1 of 2)
----------___--------------------*------------------------------------*---------
Nay 14, 1991
08:44:29
Allen-Bradley Ccppany -- Smart Linear Sensor -- Statistics Re,x,rt
Ajax Widget Co.
1234 Main Street
Center City, USA
-------__-___---------------------------------------------------*---------------
DeSCriptlOn
: Part Width
Result description for Chart A: Object vidth
Result description for Chart B: Object center
Chart Selection for Chart A:
X Bar and R and Sistcqram
chart Belection for chart B:
X and Sideways Eistcqram
--------___________----------------------- Chart A _________ Chart B _______
sample size 5 1
Lover specification Limit (LSL) 67.69
WA
upper Specification Limit (IISL) 69.69
WA
La? Value
0.00000 0.00000
Eigh Value
100.00000 100.00000
Total Number of Points 1002 1002
Number of Subgroups 200 1002
Number Below LSL
2
WA
N"mher Above USL
0
WA
N”mher O"t of Spec
2
WA
Percent Below LSL
0.20
N/A
Percent Above l3.c.L
0.00
WA
Percent CJut Of spec
0.20
WA
Maximum
69.60 60.63
ninimum
67.50 59.58
Range
2.10 1.05
Standard Deviation
0.35 0.18
variance
0.12 0.03
x Bar
68.52 60.12
Target
68.50
N/A
P-r
WA WA
x Double Bar
68.51 60.12
Calculated LCLX
68.04 59.59
Calculated UCLX
69.00 60.66
R Bar
0.83
WA
Calculated Ix2LR
0.00
WA
Calculated UCLA
1.76
WA
8-63