
User`s manual


-
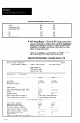
Fgure 8.25 Basic SPC Log Report: Short and Long
Hay 13, 1991 - 16:07:38
Page 1
Allen-Bradley ccmpany -- smart Linear sensor -- spc Log Report
A)ax Widget Co.
123. nain street
CenteI city, us.4
_-_________-____________________________---*------------------------------------
DWCriptiOll : Part Width
lag File : TEST.LcG
---_____________________________________----------------------------------~-----
SPC Charts
Chart A Chart B
____________________~---~-----~.--~.--------------------------------------------
Mea"
66.77 ‘4.92
Standard Deviation
0.59 0.30
nax
69.16 45.84
ain
65.84 44.27
Range
3.32 1.56
Number Of mints
332 332
l SPC Log Report (SLS scaling) - This SPC log report is
from SPC operations based on the long setup screen
only, in which logging is enabled for one or more SLS in
the SLS Scaling and Logging section of the long setup
screen. Figure 8.26, page 8-62, shows the added section
of statistics (SLS on COMl) that appears in the report
when logging is enabled for SLS 1.
Additional sections of data appear in the report for each
SLS attached to the PC and enabled for logging under
the SLS Scaling and Logging section.
8-61