
User`s manual


8-50
Highlight the Add option,
then press the ENTER key.
Type in TEST, then press
the ENTER key.
Press the ESC key, then the
ENTER key.
Using the PgDn and down
arrow keys, highlight the
Law Valuefield under SLS
1 in the SLS Scaling
section.
Press the F3 key
VerijS that “Yes” is
highlighted, then press the
ENTER key.
Enter the object size in the
real world units Of yUT
choice.
Press the ENTER key.
To start the calibration
process, press the ENTER
key again.
When the count figure
reaches 30 to 56, press the
ESC kev to stow the View
Image &d ret;m to the
long setup scxen.
Press the Control and right
arrow keys to highlight the
Law Value key under SLS 2.
Press the F3 key, then
repeat the previous steps to
enter the ~clme real world
size of the object in the
FOV of SLS 2.
-
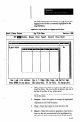
This creates a new setup record.
This names the setup record “TELST,” and moves the cursor
to the Chart Scales screen (which you will not change at
this time).
This exits and “saves” the Chart Scales screen, then
displays the Long SPC Setup Screen.
When you press F3, an explanatory message appears on the
display. Read the message, then continue.
When you press ENTER, a data entry box appears asking
you to enter the size of the object in the FOV.
-
You must enter only the numbers, not the unit name. For
example, if the object size is 3.25 inches, enter 3.25.
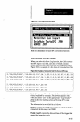
When you press ENTER, the View Image display appears.
Note that the count figure (0) and “enter” icon appear at the
bottom center of the display. The count figure shows the
number of results data acquisitions during the calibration
process.
When you press ENTER, the CSS begins acquiring results
data (object width or edge location), and the count figure
begins to increment.
The CSS calculates the average of the accumulated results,
and uses that as the basis of the calibration.
Note that the calibrated values appear in the low and high
value fields.
At this point, the inspection results from SLS 1 and SLS 2
can be combined in a chart formula, as described in Chart
Form&s: Chart A and Chart B on page 8-39.