
User`s manual


-
Highlight the “TEST’ setup
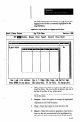
Note that the Chart Scales screen shows the calibrated low
record,
and high values. They sre the same for both charts.
The calibrated low value is always zero. The calibrated
high value reflects the “real world” value entered and the
percentage of the SLS FOV that it occupies.
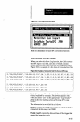
Highlight the Modi&
option, then press th-e
ENTER key.
As an example, if you enter 4.0 as width of anobject, and it
occupies exactly 50% of the FOV, the CSS will calculate
the high value as 8.0. It will then base all subsequent width
measurements on a 0-to-8.0 scale.
When you press ENTER, the long setup screen appears on
the display.
Note that the CSS has inserted the calibrated chart scales
values into the Low Value and High Value fields of the
setup screen.
Note that the CSS has also calculated the appropriate X bar
and R chart boundaries for charts A and B and inserted
them into the corresponding fields of the setup screen.
This completes the single SLS calibration procedure.
Multiple SLS Calibration
Here is an example procedure in which the results from two
SLS’s are calibrated for use in a formula. Then, the chart
scales are altered manually to accommodate the maximum
real world values that are likely to result from the formula.
For the purposes of this procedure, assume that the SPC
Setup Menu is on the display and the Chart Selection and
Setup Menu option highlighted, as shown in Figure 8.3 on
page 8-10.
Note: Each SLS must be configured using either the I-D
Spatial Measurement function or the Object Width
function. In addition, each SLS must be staged using an
“ideal” object of known size, as appropriate for the
application.
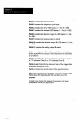
Your Action
Highlight the Long SPC
Setup Menu, then press the
ENTER key to select that
menu.
Comments
When the menu appears on the display, note that the “F3
calibrate” prompt appears in the prompt line.
849