
User`s manual


To start the calibration
process, press the ENTER
key again.
When the countfigure
reaches 30 to 50. Dress the
ESC key to stop ihe View
Image and return to the
Chart Selection and Setup
Menu.
Press the ENTER key to
select the highlighted chart
option and begin SPC
operations.
After a minute or so, press
the ESC key to stop the
SPC operation.
Highlight the “Save SPC
Setup Conjiguration”
option, then press the
ENTER key.
Type in TEST, then press
the ENTER key.
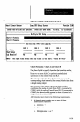
When you press ENTER, the CSS begins acquiring results
data (object width or edge location), and the image count
begins to increment.
The CSS calculates the average of the accumulated results,
and uses that as the basis of the calibration.
Note that the X Bar and R and Histogram chart option is
highlighted. This chart option is used in the next steps.
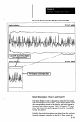
When you press ENTER, the CSS enters the initialization
phase, then starts the SPC operation using the calibrated
chart scales.
Note that the data tables alongside the charts reflect the
“real world” value that you entered. The X bar value should
be close to that value. Thus, if you entered 3.5, X bar
should be 3.5 (plus or minus a small amount) if you are
measuring the same object repeatedly.
When you press ESC, the Chart Selection and Setup Menu
appears again on the display.
When you press ENTER, the data entry box for the record
name appears on the display.
When you press ENTER, the setup record is saved.
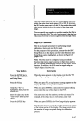
Use the next steps to review the TEST setup record in the
long setup screen.
Press the ESC key to return
to the SPC Setup Menu.
Highlight the “Long SPC When you press ENTER, the long setup menu appears on
Setup Menu” option, then
press the ENTER key.
the display.
8-48