
User`s manual
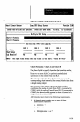


Your Action
Comments
Press the ENTER key to
select the Chart Selection
and Setup Menu.
Press the F3 key
Verifi that “Yes” is
highlighted, then press the
ENTER key.
Enter the object size in the
“real world” units ofyour
choice.
Press the ENTER key.
lOO), the results data from the SLS could appear anywhere
within the entire chart scale range of 0 to 100. If, however,
the SLS scales were reset to 0 and 10, the results data could
only appear within the 0 to 10 portion of the chart scale
range.
You can specify any negative or positive number that fits in
the ten-character field. The only requirement is that the low
value must be lower (or more negative) than the high value.
Single SLS Calibration
Here is an example procedure for performing simple
calibration, where only one SLS is used.
For the purposes of this procedure, assume that the WC
Setup Menu is on the display and the Chart Selection and
Setup Menu option highlighted, as shown in Figure 8.3
(page 8-10).
Note: The SLS must be configured using an analysis
function that returns edge locations or object size, such as
the 1-D Spatial Measurement function or the Object Width
function. In addition, the SIS must be staged using an
“ideal” object of known size.
When the menu appears on the display, note that the “F3
calibrate” prompt appears in the prompt line.
When you press F3, an explanatory message appears on the
display. Read the message, then continue.
When you press ENTER, a data entry box appears asking
you to enter the size of the object in the FOV.
You must enter only the numbers, not the unit name. For
example, if the object size is 3.25 inches, enter 3.25.
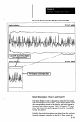
When you press ENTER, the View Image display appears.
Note that the “image count” (0) and the “enter” icon appear
at the bottom center of the display. The image count shows
the number of images acquired during the calibration
process.
g-47