
User`s manual


-
Calibration, Chart Scaling, and SLS Scaling
CuZibration enables you to convert or “rescale” inspection
results data from an SLS, which you normally see as
percentages from 0% to 100% in the Monitor and View
Image displays, to “real world” units of your choice, such
as inches, centimeters. and so on. The effect is that when
you perform SPC operations, the statistical data is based on
actual measurement values.
The simplest calibration procedure can measure an “ideal’
object of known size and automatically calibrate the chart
scale values accordingly. This procedure is available from
the Chart Selection and Setup Menu in the SPC Setup
Menu, and also from the Charts option of the short and long
setup menus.
A mom complex calibration procedure can measure a
different “ideal” object of known size for each SZS, when
more than one SLS is used, and combine their calibrated
values in formulas. You then manually change the chart
scale values to reflect the lowest and highest combined
measurement. This procedure is available only in the Long
SPC Setup Screen.
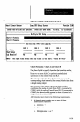
Chart scaling involves altering the low and high values in
the Chart Scales screen (next to the Long SPC Setup Menu)
in order to rescale the results data from the SL.S. Thus, if
the results data ranges from 20 to 30 when the Chart Scales
values are 0 (low) and 100 (high), the same data will range
from 10 to 15 if you alter the Chart Scales values to 0 (low)
and 50 (high).
You can specify any negative or positive number that fits in
the ten-character field. The only requirement is that the low
value must be lower (or more negative) than the high value.
SLS scaling involves entering low and high scaling values
for individual SLS’s. (The associated data entry fields are
in the SLS Scaling section of the long setup menu.
One function of SLS scaling is to enable you to set each
SLS to a different scale, where each can serve its own
purpose insofar as the accumulation of SPC data is
concerned. Another function of SLS scaling is to enable
you to calibrate multiple SLS’s so that their results reflect
the same basic measurement units in formulas.
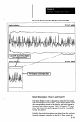
The practical effect of SLS scaling is to alter the
relationship between the SLS field of view (FOV) scales
and the chart scales. Thus, if the SLS scaling values were
the same as the Chart Scale values (for example, 0 and
8-46