
User`s manual


Note: Your process must be both normally distributed and
in control in order to use the estimated value of sigma.
Refer to Appendix C. SPC Formulas, for an explanation of
the formulas used to calculate Cp, Cpk, and estimated
sigma.
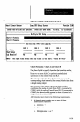
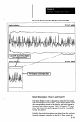
Control Chart Panning Percentage
Use these fields to enter the percentage of the control charts
to be cleared at the end of the “panning” cycle, when the
charts are full. The valid percentage numbers range from
25% to 100%.
If the percentage is set to lOO%, the control charts are
cleared entirely, and the next panning cycle begins at the
left boundary of each chart. If the percentage is set to 80%,
the last 20% of the previous cycle is redisplayed on the left
side of each chart, and the next panning cycle begins at the
20% point. Figure 8.18, page 8-43, shows how this works.
-
Note: The smaller the panning percentage, the longer the
redisplay time. If you select 2.5%, the CSS must redisplay
75% of the previous panning cycle; thus, you may see the
“W” (warning) symbol if the redisplay time has reached the
point where your PC cannot keep pace with the SLS.
8-42