
User`s manual


-
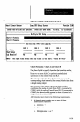
Figure8.16 LongSPCSetupScreen(Part3.of4)
Smart Linear Sensor Long SPC Setup Screen
Version 2
Enter the On-Line SPC options. Press ESC uhen done. Fl help. I’3 calibrat
llultiple SLS Setup
Chart fI Fomula
Chart B Pm-da
SLS Scaling UOU) and Logging
SLS 1
Lou Value
High Value
Log Results? No
SLS 2 SLS 3 SLS 4
No No
No
NOTE:
-
The high value rimts the lw value is the SLS’s “Field Of View”
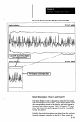
Chart Formulas: Chart A and Chart B
Use these fields to specify formulas that combine and/or
perform mathematical operations on the inspection results
from two or more SLS’s, or perform mathematical
operations on the results from one SLS.
The altered results data from the formula appear in the
corresponding chart instead ofthe normal results data from
a single analog output.
For example, if the Chart A Formula field specifies
combining the analog A result from SLS 1 (connected to
COMl) with the analog B result from SLS 2 (connected to
COM2), the altered result appears in chart A instead of a
single result from either SLS.
All formulas must observe the following requirements.
1. A formula must contain one or more of these
mathematical operators:
a. Addition: +
b. Subtraction: -
c. Multiplication: x or *
8-39