
User`s manual


To continue on to the Long SPC Setup Screen, press the
EW key, then press the ENTER key to “save” the Chart
Scales screen and display the fiit group of data entry and
option fields in the setup screen, as shown in Figure 8.12.
(The remainder of the long setup Screen is shown in
Figure 8.14, page 8-34; Figure 8.16, page 8-39; and
Figure 8.17, page 8-41.)
Smart Linear Sensor
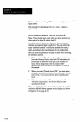
Figure 8.12 Long !WC Setup Screen (Part 1 of 4)
Long SPC Setup Screen
Version 2
Enter the On-Line SPC options. Press ESC uhen done. Fl help. F3 calibrat
chart A ChartB-
Lou Ualue
e.BmEl B.BBBEm
High Value
ma I fiBeBB
ieB.eElBae
Sample size
1
I
Lower Specification Limit (LSL)
Upper Specification Limit (USL)
Iarget
Display chart?
Yes Yes
Chart selection for Chart A X and Sideways Histogram
Chart selection for Chart B X and Sideuays Histogram
X or X Bar Chart Setup
Lower Chart Boundary
Upper Chart Boundary
Display control linits?
Refer to Figure 8.12, above, for the following descriptions
of the data entry and option fields in the Long SPC Setup
Screen.
Description
Use this field to identify the SPC setup record with a
unique name or description, preferably one that identifies
its SPCfinction. You can enter any series of up to 60
printable characters. The minimum is one character.
8-29