
User`s manual


5. X and Sideways Histogram - This option plots
graphic data as follows:
a. Individual data points (X).
b. A running average of individual data points (X
bar).
c. Upper and lower control limits for X.
d. A sideways histogram based on X data.
6. p Chart and Sideways Histogram-This option plots
graphic data as follows:
a. Individual data points (p).
b. A running average of individual data points 6).
c. Upper and lower control limits for p.
d. A sideways histogram based on p data.
7. p Chart and Histogram - This option plots graphic _
data as follows:
a. Individual data points @).
b. A running average of individual data points 6).
c. Upper and lower control limits for p.
d. A histogram based on X data.
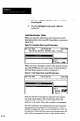
Save Statistics?
Use these two fields to indicate whether you want the CSS
to save and/or use saved statistics, as follows:
l In the&? field, select “Yes” if you want the CSS to
save the accumulated statistics when you press the RSC
key to discontinue an SPC operation. Otherwise, select
“No.”
You can use saved statistics for the “Saved Statistics
Report” and/or as the statistical starting basis for the
next SPC operation.
l In the second field, select “Yes” if you want the CSS to
begin an SPC operation using statistics saved from
previous SPC operations. Otherwise, select “No.”
8-24