
User`s manual


Here are the chart options in the Chart Selection Menu.
(Note that the first five options are the same as those in the
Chart Selection and Setup Menu shown in Figure 8.8 on
page 8-22.)
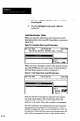
1. X Bar and R and Histogram - This option plots
graphic data as follows:
a. Subgroup average data (X bar).
b. A running average of X bar data (X double bar).
c. A histogram based on X data.
d. Range data points (R).
e. A running average of range data (R bar).
f. Upper and lower control limits for X bar and R.
2. X Bar and s and Histogram - This option plots
graphic data as follows:
a. Subgroup average data (X bar).
b. A muting average of X bar data (X double bar).
c. A histogram based on X data.
d. Standard deviation data points (s).
e. A running average of standard deviation data (s
bar).
f. Upper and lower control limits for X bar and s.
3. X Bar and Histogram - This option plots graphic data
as follows:
a Subgroup average data (X bar).
b. A running average of X bar data (X double bar).
c. A histogram based on X data.
d. Upper and lower control limits for X bar.
4. X and Histogram -This option plots graphic data as
follows:
a Individual results data points (X).
b. A running average of individual data points (X
bar).
c. Upper and lower control limits for X.
d. A histogram based on X data.
S-23