
User`s manual


results description for chart A is First Edge, and the
description for chart B is Last Edge. These reflect the
results frcm the analog A and B outputs.
You can use these fields to enter any name or description,
up to 33 characters long, that is better suited to your
application.
Chart Selection: Chart A and Chart B
Use the chart selection fields to select a chart option for
chart A and chart B. You can select the same chart option or
different chart options for each chart, according to the
requirements of your application.
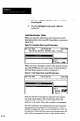
When you highlight either field, the Chart Selection Menu
appears on the display, as shown in Figure 8.8.
Figure 88 Chart Selection Menu
X Ear and R and Histogram
X Bar and s and Histogram
X Bar and Histogram
X and Histogram
X and Sideways Histogram
p Chart and Sideways Histogram
p Chart and Histogram
8-22
You can select a chart option using either of the following
methods:
l Use the SPACE BAR to scroll donvr through the list of
chart options in the menu, or use the BACKSPACE key
to scroll up. In either case, the currently selected chart
option appears in the chart selection field. Stop scrolling
when you see the correct chart option in the field.
l Press the TAB key. When you do this, the current chart
option (the one in the chart selection field) is highlighted
in the menu. Use the down (or up) arrow key to
highlight the correct chart option, then press the ENTER
key to select that option.
-