
User`s manual


Sample Size
Use this field to enter the sample size, which is the number
of data points (inspection results) to be used in each
subgroup. The sample size to enter depends partly on the
chart options that you intend to use for charts A and B, as
follows:
l For the “x” chart options, which display individual
inspection results, the sample size must always be 1.
l For the ‘%” chart options, which display inspection
results averages, the sample sire must be 2 or greater
(up to 99).
l For the “p” chart options, the sample size can be 1 to
9999. The number selected depends on the actual
“sample” of items whose percentage of defective items
the p chart displays.
Specification Limits (USL and LSL)
Use these fields to enter the upper and lower specification
limits for the items being inspected (if you enter &her
limit, you must enter the other limit also). When you use
the X or x chart options, and enter the specification limits,
the CSS calculates and displays Cp, Cpk, and Cr, the
process capability indices.
Note: When you use the p chart options, you must enter
both specification liits if you select “Result out of spec”
in the p Chart Attributes Method Menu, since the CSS
calculates the percentage of defective items (p) as the
number of items whose inspection result is outside eirher
specification limit divided by the number of items in the
sample.
(For more information about chart attributes, refer to Chart
Attributes Method: Chart A and Chart B on page g-36.)
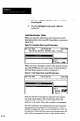
Result Description: Chart A and Chart B
Use these fields to enter a descriptive name for the results
that are displayed in each chart. These names appear above
the corresponding charts in the display, and also appear in
the setup and statistics reports.
Initially, the result descriptions are taken from the analysis
function currently operating in the SLS. Thus, when the
1-D Spatial Measurement function is in operation, the
g-21