
User`s manual


5.
6.
7.
8.
9.
c. Upper and lower control limits for X.
d. A histogram based on X data.
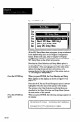
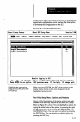
X and Sideways Histogram-This option plots
graphic data as follows:
a Individual data points (X).
b. A running average of individual data points (X
bar).
c. Upper and lower control limits for X.
d. A sideways histogram based on X data.
‘lkn Logging On (Off) -Select this option to enable
(if OJ) or disable (if On) the logging function.
(Logging operations are described in Logging
Functions on page 8-52.)
Log File Conversion - Select this option to convert
the data accumulated in the log file to a format that is
compatible with one of a number of other application
programs, such as Lotus 123 and MetiStat Lab. (Log
file conversions are described in Conversion Functions
on page 8-54.)
SPC Log Report - Select this option to generate a
report that is based on the data accumulated in the log
file. You can elect to review the report on the display,
print the report, or save the report to a DOS file.
(These reports are described in Report Functions on
pai+ 8-W
Delete SPC Log - Select this option to delete the SPC
log fiie.
10. Save SPC Setup Configuration - When you end an
automatic SPC operation, you can select this option to
save the SPC setup record that was created
automatically by the SPC operation that you just ended.
(You can access the saved setup record by selecting
one of the other three SPC setup menus: run-only,
short, or long.)
F3 Calibrate Function
When you selected the Chart Selection and Setup Menu, the
prompt line added the “F3 calibrate” function, which
enables you to convert SLS inspection results ranging from
0% to 100% into “real world” units, such as inches or
8-13