
User`s manual


-
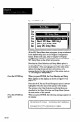
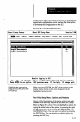
Chart Selection and Setup Menu: Options
Here are the options in the Chart Selection and Setup
Menu. Note that when you select one of the chart options, it
applies to both chart A and chart B.
To select any menu option, first highlight the option, then
press the ENTER key.
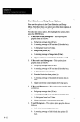
1. X Bar and R and Histogram - This option plots
graphic data as follows:
a.
Subgroup average data (X bar).
b.
A running average of X bar data (X double bar).
c.
A histogram based on X data.
d. Range data points (R).
e.
A running average of range data (R bar).
f.
Upper and lower control liits for X bar and R.
2. X Bar and s and Histogram - This option plots
graphic data as follows:
a.
Subgroup average data (X bar).
b.
A running average of X bar data (X double bar).
c.
A histogram based on X data.
d.
Standard deviation data points (s).
e.
A running average of standard deviation data (s
bar).
f.
Upper and lower control limits for X bar and s.
3. X Bar and Histogram - This option plots graphic data
as follows:
a.
Subgroup average data (X bar).
b.
A running average of X bar data (X double bar).
c.
A histogram based on X data.
d.
Upper and lower control limits for X bar
4. X and Histogram -This option plots graphic data as
follows:
a.
Individual results data points (X).
b.
A running average of individual data points (X
bar).
8-12