
User`s manual
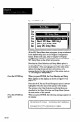


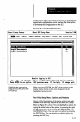


Figure 8.4 Chart 8ektion and setup Menu
I Ii1
Log File Conversion
Results logging is Off.
(The number YYY is derived from the numbers entered in
the Program Configuration Screen under the Automatic
SPC Setup section. The CSS multiplies the “Number of
subgroups” by the “Number of inspections per subgroup”
to get YYY. The number XXX is updated until it equals
YYY.)
This is the “automatic” part of the Charts method. The CSS
performs YYY inspections during initialization in order to
accumulate results data, which it then uses to calculate the
upper and lower chart boundaries during initialization.
After completing initialization, the CSS displays the
selected SPC charts and begins displaying graphic and
statistical data in those charts, as shown in Figure 8.2 (page
8-5).
Because of the chart boundary calculations performed
automatically during initialization, the graphic data should
appear properly distributed (verficully) within the upper and
lower chart boundaries. (If the chart boundaries were not
appropriately set, the data may appear in a very narrow
band, or, the data may be “off the chart,” and you would
probably see only a flat line along the top or bottom of the
chart.)
8-11