
User`s manual


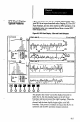


12. Plus Icon-This icon signifies that when you press the
“+” key (or “click” the icon with the mouse), the
apparent panning speed of the chart increases. The
visual effect is to “stretch” the data display
horizontally.
13. Minus Icon -This icon signifies that when you press
the “-” key (or “click” the icon with the mouse), the
apparent panning speed of the chart decreases. The
visual effect is to “shrink” the data display horizontally.
14. Tab Icon - This icon signifies that you can display
upper and lower control limit data for either chart A or
chart B by pressing the TAB key (or “clicking” the
icon with the mouse).
When you press TAB thefirst time, UCL and LCL data
for chart A appear at the bottom of the display, and the
“Histogram” label for chart A is highlighted in reverse
video. When you press TAB the second time, the same
result occurs for chart B . When you press TAB the
third time, the UCL and LCL data are removed. (By
using the SHIFT and TAB keys, you can reverse this
movement.)
When the “Histogram” label is highlighted, the Plus,
Minus, Stop, and Freeze icons apply only to the
corresponding chart (A or B).
When only one chart is displayed, the UCL and LCL
data appear automatically, and the TAB key has no
effect.
15. Stop Icon - This icon signifies that when you press the
“S” key (or “click” the icon with the mouse), the data
display stops. Data accumulation continues, however.
When you press the “S” key again, the data display
resumes, reflecting the updated condition of the data
and statistics that accumulated from the time that the
data display stopped.
(Alternatively, you can press the F3 key to stop the data
display and start it again.)
16. Freeze Icon -This icon signifies that when you press
the “F’ key (or “click” the icon with the mouse), the
data display freezes when it reaches the right chart
boundmy. Data accumulation continues, however.
When you press the “F’ key again, the data display
resumes, reflecting the updated condition of the data
-
-
8-8