
User`s manual


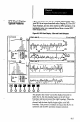


7. Histogram: Chart A - This histogram reflects the
inspection results (or formula results) that am
displayed on chart A.
The bars or “cells” in a verticuf histogram indicate
relative accumulations of data point values that fall
within both an overall range (max. - min.) and several
subordinate ranges that are determined by the number
of cells in the histogram (see Long SPC Setup
Method).
Both the “max. -min.” range and the cells are updated
continually as the data points accumulate; thus, the
range within each cell is always a function of the max.
- min. range divided by the number of cells specified
for the histogram.
The cells in a horizontal histogram indicate the actual
accumulations of data point values that fall within the
subordinate ranges determined by the upper and lower
chart boundaries and the number of cells specified for
the histogram.
8. Histogram: Chart B -This histogram reflects the
inspection results (or formula results) that are
displayed on chart B.
9. Statistics: Chart A -This table of accumulated
statistics is based on the inspection results (or formula
results) displayed on chart A and the chart option
designated for chart A. Its specific contents vary to
some degree with the graphics adapter installed in your
PC and with the graphics mode selected in the Progrsm
Configuration Screen.
10. Statistics: Chart B -This table of accumulated
statistics is based on the inspection results (or formula
results) displayed on chart B and the chart option
designated for chart B. Its specific contents vary to
some degree with the graphics adapter installed in your
PC and with the graphics mode selected in the Program
Configuration Screen.
11. A-B Icon - This icon signifies that when you press the
“A” or “B” (or “click” the icon with the mouse), the
online help screen appears. The messages in this screen
explain briefly the function of the other icons.
(Alternatively, you can press the Fl key to display the
help screen.)