
User`s manual


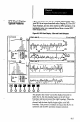


Figure 8.2 (page 8-5) also identifies the main features of a
typical chart display. They are identified by the circled
numbers. and are described briefly as follows:
1. Chart A - This two-part chart reflects the inspection
results from analog output A on the SLS, except when
a formula is defined for chart A. In that case, chart A
reflects the results from the formula
These charts display the data points, the average of the
data points, and the upper and lower control limits
applicable to the results data from the data points.
2. Chart B -This two-part chart reflects the inspection
results from analog output B on the SLS, except when
a formula is defined for chart B. In that case, chart B
reflects the results from the formula.
This chart operates the same as chart A, however, in
the short and long SPC setup methods, you can
designate different chart options for charts A and B.
3. Data Points - Each point along this line represents one
data point. The line makes the data points more visible.
(The meaning of the data points depends on the chart
selection. Since this is an “X Bar and R and
Histogram” chart, each data point represents the
average value, or X Bar, of every sample or subgroup
inspected.)
4. Data Point Average -This line represents the current
average of all of the data points displayed along the
line (4). (Since this is an “X Bar and R and Histogram”
chatt, the data points are themselves averages, or X Bar
(F). Thus, the grand average of the averages is called X
Double Bar.)
5. Upper Control Limit @JCL) - This line represents the
current value of the upper control limit. When the
process results (data points) are below this limit, the
process is considered to be in control.
6. Lower Control Limit (LCL) - This line represents the
current value of the lower control limit. When the
process results (data points) are above this limit, the
process is considered to be in control.
-
8-6