
User`s manual


Here are some performance guidelines:
l
An IBM AT or compatible PC, operating at 8Mhz, with
a math coprocessor, can service four SLS’s delivering a
total of 30 SLS inspection results “data points” per
second.
l
An IBM XT or compatible PC, operating at 4.77Mhz.
without a math coprocessor, can service five SLS
inspection results “data points” per second.
The remainiig sections of this manual provide details about
using each of the SPC setup and operation methods
outlined above.
Note: Before continuing with this chapter, you should
become familiar with the SLS staging and configuration
procedures described in the other chapters of this manual.
-
ing the SLS For For the purpose of the procedures in this chapter, it is
Data Displays
assumed that you have staged and configured the SLS to
inspect real objecfs. Your SLS and PC should be set up
either in a testing area in which the SLS inspects a large
representative sample of objects repeatedly, or in an actual
workplace se&g in which the SLS inspects a stream of
different objects.
The point to remember is that you must always conjgure
and properly stage the SLS before you atfempt to perform
SPC operations.
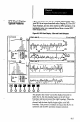
During SPC operations, when the variation in the position
(or dimension) of the objects has a “normal” statistical
variation, as reflected in the inspection results, the SPC data
displays typically have a statistically “normal” appearance
This is particularly true of a histogram, which tends toward
a bell-shaped pattern when displaying a normal statistical
distribution.
Figure 8.1 on page 8-4 shows the bell-shaped appearance
of vertical and horizontal (“sideways”) histograms when
displaying normal statistical distributions.
8-3