
Specifications


Debugging a Device Driver
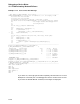
11.4 Troubleshooting Network Failures
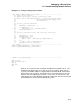
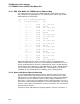
Example 11–9 Using the Debug Step Command
- SRC: module C_TEST_ROUTINES -scroll-source------------------------------------
46: Source line not available
47: #pragma noinline(test_c_code,test_c_code2,test_c_code3)
48: extern volatile int64 xdt$fregsav[34]; /* Lie and say these are integer
49: use iregsav because the debugger will r
50: be using those!*/
51:
52: int test_c_code3(int subrtnCount)
53: {
54: subrtnCount = subrtnCount - 1;
55: if (subrtnCount != 0)
-> 56: subrtnCount = test_c_code3(subrtnCount);
57: return subrtnCount;
58: }
59: int test_c_code2(int64 in64,int in32, int64 test, int64* pVar)
60: {
61: xdt$fregsav[5] = in64;
62: xdt$fregsav[6] = in32;
63: if (xdt$fregsav[9] > 0)
64: *pVar = (*pVar + xdt$fregsav[17])%xdt$fregsav[9];
65: else
66: *pVar = (*pVar + xdt$fregsav[17]);
67: xdt$fregsav[7] = test_c_code3(10);
- OUT -output-------------------------------------------------------------------
break at C_TEST_ROUTINES\test_c_code3\%LINE 56
break at C_TEST_ROUTINES\test_c_code3\%LINE 56
- PROMPT -error-program-prompt--------------------------------------------------
DBG> Scroll/Up
DBG> set break %Line 56
DBG> go
DBG> step
DBG>
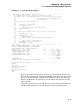
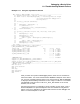
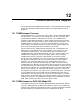
Now, you try a couple of other commands, EXAMINE and SHOW CALLS. The
EXAMINE command allows you to look at all the C variables. Note that the
C_TEST_ROUTINES module is compiled with the /NOOPTIMIZE switch which
allows access to all variables. The SHOW CALLS command shows you the call
sequence from the beginning of the stack. In this case, you started out in the
image EXEC_INIT. (The debugger prefixes all images other than the main image
with SHARE$ so it shows up as SHARE$EXEC_INIT.)
11–21