
User`s guide


SHOW
• Start address of the job’s impure area
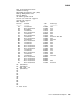
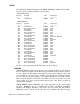
The following example displays data about currently running jobs:
.SHOW JOBS
JOB NAME CONSOLE LEVEL STATE LOW HIGH IMPURE
--- ---- ------- ----- ----- --- ---- ------
14 QUEUE 0 6 SUSPEND 116224 130306 115254
0 RESORC 0 0 RUN 000000 126110 132344
MEMORY
Lists the organization of physical memory. MEMORY shows the location of each
low memory component and, under a mapped monitor, each extended memory
region as well.
The MEMORY listing displays such information as where jobs are loaded, where
device handlers are loaded, where in memory KMON and the USR will reside,
the number of words of memory each occupies, and the type of region in the
extended memory map. Memory addresses are displayed in octal.
The SHOW MEMORY command displays cache-bypass status for a global region,
using the symbol BYP rather than the symbol GBL.
If you are running under a mapped monitor, the SHOW MEMORY listing is
divided into two sections, the first for extended memory and the second for kernel
memory.
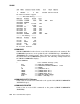
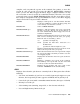
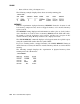
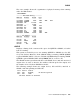
The following example displays the organization of physical memory when
running under the SB monitor:
.SHOW MEMORY
Address Module Words
------- ------ -----
160000 IOPAGE 4096.
154332 DU 915.
135166 RMON 3890.
001000 ..BG.. 23611.
306 RT–11 Command Descriptions