
Technical data

Compiler Commands [2]
2.16.1 -F (CC, cc)
(UNICOS systems) The -F option enables the generation of additional run-time
code that is needed by Perftrace or Flowtrace. Perftrace and Flowtrace are
program analysis tools that display the call tree of a program and the amount
of time spent in each function. To use perfview, you must also specify the
-l perf option. See the perftrace or flowtrace(7) man page for more
information.
2.16.2 -h listing (CC, cc)
Default option: Listing is off
(UNICOS systems) The -h listing option generates a pseudo assembly
language listing. The listing file name is the same as the source file name, with
the suffix replaced by a .L.
2.17 Debugging Options
The following sections describe compiler options used for debugging.
2.17.1 -G level (CC, cc) and -g (CC, cc, c89)
The -g and -G level options enable the generation of debugging information
that is used by symbolic debuggers such as totalview. These options allow
debugging with breakpoints. For the -G option, level indicates the following:
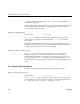
Table 2. -G level Definitions
level
Optimization Breakpoints allowed on
f
Full Function entry and exit
p
Partial Block boundaries
n None
Every executable statement
More extensive debugging (such as full) permits greater optimization
opportunities for the compiler. Debugging at any level may inhibit some
optimization techniques, such as inlining.
The -g option is equivalent to -Gn. The -g option is included for compatibility
with earlier versions of the compiler and many other UNIX systems; the
S–2179–36 29