
User guide


Perform Colony Counting
203
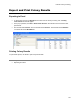
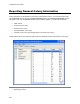
Reporting Colony Distribution Information
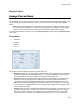
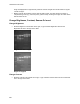
Distribution information can be displayed in the Colony Count Results window. To access the window
click onto the Results menu button from the Colony Counting Action Tab. A Colony count results
window will appear. Then click onto the Distribution tab after the new window appears. The Distribution
tab displays graphical information.
• The dropdown menu allows users to report graphical information about the average diameter,
area, perimeter, and circularity of the colonies counted in the Petri dish.
• Users may also change the number of bins that are set to display in the graph.
All dimensional values are reported in pixels unless the calibration process is performed on the image.
Related Topics:
• Reporting Functions