
User guide


LS Software User Guide
126
Concentration Calibration
• Graph Options
• Change Unit Type
• Select Unit Type
• Add, Edit or Delete a Unit Type
• Select Data Points
• Select Curve Type
• Remove Concentration Calibrations
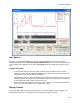
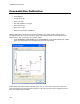
With the background of the image corrected, the software is now ready to graph intensity versus
concentration and to fit curves or lines on the graph. It also allows the user to change the Unit Type
plotted on the y-axis. To Show the Concentration Graph:
• From 1D Analysis > Lane Profile click on Concentration. A new window appears with a blank
graph. (The image below includes data points that have been added)
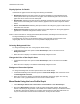
Graph display and units are easily modifiable by the user. The user may change the unit type or the
colors of the background, data points and graph line. The user may also choose to display the anchor
lines, point names and point values.