
User Guide


42 l uponorengineering.com
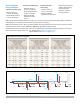
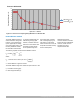
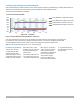
Comparing Darcy-Weisbach and Hazen-Williams
NSF performed testing to calculate the friction loss of Uponor PEX pipe and Uponor ProPEX ttings. The testing allowed Uponor to
analyze empirical test data and compare it with the Darcy-Weisbach and Hazen-Williams methods.
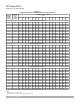
The following graph illustrates the comparison.
The Y axis represents the percent error from the test data; the X axis represents nominal pipe size. The graph shows
the average error when using the Darcy-Weisbach method is less than 1 percent when compared to the test data.
The Hazen-Williams method, however, yields an 18 percent average error compared to the test data.
Note: The test was performed with 70°F (21.1°C), 100 percent water.
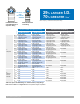
Friction loss of ttings
There are two commonly
accepted methods when
analyzing pressure loss or
head loss of ttings. The rst
and preferred method uses C
v
values to precisely calculate
tting losses. The C
v
value
represents how many gpm can
ow through a tting at 1 psi
pressure drop.
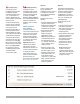
For example, a tting with a C
v
of 5.0 would ow 5.0 gpm at a
1 psi pressure drop across the
tting. Since C
v
is a function
of ow rate versus pressure
drop, it yields an accurate
representation of tting friction
loss. The second method
uses equivalent lengths.
Uponor has created charts
for both equivalent length and
C
v
. The equivalent lengths
were developed using a ow
velocity of 8 fps.
-10%
-5%
0%
5%
10%
15%
20%
25%
30%
0.0 0.5 1.0 1.5 2.0 2.5 3.0
Pipe size — nominal
Percent error from test data
Darcy-Weisbach % difference from test
Darcy-Weisbach average error from test
Hazen-Williams % difference from test
Hazen-Williams average error from test
Figure 4-8: Darcy-Weisbach and Hazen-Williams comparison