
L16 AGM Battery Specifications
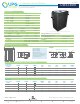

Charge Chatacteristic Curve Cycle Service Life in Relation to Depth of Discharge
Temperature Eects on Capacity
Relationship Between Charging Voltage and Temperature
Self Discharge Characteristic
www.upgi.com
Let UPG Power Your Life.
UPG No. 40870
Maintenance-Free
UB63800
Cycle
Service
Life
in
Relation
to
Depth
of
Discharge
Self Discharge Characteristic
Number of cycles(cycles)
Capacity(%)
80% D.O.D.
120
100
80
60
40
20
0
200 400
600
800
1000
1200 1400
20%D.O.D.
50%D.O.D.
Relationship Between Charging Voltage and Temperature
Battery voltage(V)
6.75
6.5
6.25
6
5.75
5.5
0 10 20 30 40 50 60 70 80 90 100
Charging time (hours)
Charged
Volume
(%)
Current
(XCA)
Voltage
(V)
7.50
8.00
7.00
6.50
6.00
0.25
0.20
0.15
0.10
0.05
0
0 2 4 6 8 10 12 14 16 18 2 0
Constant voltage charge characteristic
o
(0.25CA,20 C)
CHARGED VOLUME
140
120
100
80
60
40
20
0
CHARGE VOLTAGE
CHARGING CURRENT
Temperature
Eects
on
Capacity
120
100
80
60
40
20
0
-20 -10 0 10 20 30 40 50
Capacity (%)
o
Temperature( C)
0.1C
0.2C
1.0C
2.0
C
Te
mp
er
at
ur
e
E
ec
ts
o
n
Ca
pa
ci
ty
Self
Discharge
Characteristi
c
110
100
90
80
70
60
50
40
0 2 4 6 8 10 12 14 1 6 18 20
Storage time: months
Capacity(%)
o
40 C
o
30 C
o
20 C
Relationship
Between
Charging
Voltage
and
Temperature
Re
la
ti
on
sh
ip
B
et
we
en
C
ha
rg
in
g
Vo
lt
ag
e
an
d
Te
mp
er
at
ur
e
-10 0 10 20 30 40 50 60
o
Ambient temperature( C)
(V/12V)
15.6
15.0
14.4
13.8
13.2
(V/8V)
(V/6V)
(V/4V)
(V/CELL)
10.4
10.0
9.6
9.2
8.8
7.8
7.5
7.2
6.9
6.6
5.2
5.0
4.8
4.6
4.4
2.6
2.5
2.4
2.3
2.2
STAND BY
US
E
CYCL
E U
S
E
Relationship of OCV and State of Charge (20 C)
Relative State of Charge (%)
488 S.Royal Lane Coppell, Texas 75019 P 469.892.1122 T 866.892.1122 F 469.892.1123 sales@upgi.com
Discharge Time vs. Discharge Current
Discharge Characteristics
(Minute) (Hour)
Discharge time
Cell voltage (V/Cell)