
User Manual
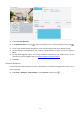
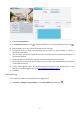
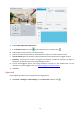

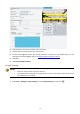
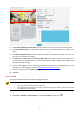
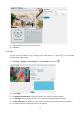
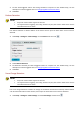
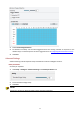
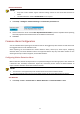
Table Of Contents
- Copyright
- Trademark Acknowledgement
- Disclaimer
- Environmental Protection
- 1 Network Connection
- 2 Login
- Preparation
- Logging In to the Web Interface
- 1. Browse to the login page by entering the correct IP address of your camera in the address bar.
- 2. If you log in for the first time, follow system prompts and install the ActiveX. You need to close your browser to complete the installation.
- 3. Enter the username and password, and then click Login. For the first login, use the default username “admin” and password “123456”.
- Introduction to the Web Interface
- Initial Configuration
- 3 Configuring Parameters
- Local Parameters
- Network Configuration
- Ethernet
- Static Address
- PPPoE
- DHCP
- IPv6
- Wi-Fi
- 1. Click Setup > Network > Network. Click the Wi-Fi tab.
- 2. Select Sniffer.
- 3. Click Save.
- 1. Select Setup > Network > Network. Select Wi-Fi for Wi-Fi Mode.
- 2. Signal strength is displayed. Turn on Adaptive Streams. The page shows that there are other Wi-Fi networks. To search for Wi-Fi networks again, click Search.
- 3. Click an SSID in the Wi-Fi Network list. Information about the corresponding network is displayed.
- 4. Click Save.
- 5. When Wi-Fi Mode is set to Wi-Fi Hotspot, the camera can function as a Wi-Fi hotspot for other devices.
- 6. Click Save.
- Port
- FTP
- General
- 1. Click Setup > Storage > FTP. Go to General tab.
- 2. Set the IP address and port for the FTP server, username and password used to upload images to the FTP server, select Upload Images, Overwrite Storage and set Overwrite At (threshold for overwriting images). Some camera models support FTP test. You...
- 3. Set the path for saving snapshots on the FTP server and the file name format. For example, set path as Preset No.\\IP Address\\Date\\Hour(s), and set file name as Preset No.-PTZ Zoom-PTZ Latitude-PTZ Longitude.jpg.
- 4. Click Save.
- Smart
- 1. Click Setup > Storage > FTP. Go to Smart tab.
- 2. Set the IP address and port of the FTP server, username and password used to upload images to the FTP server.
- 3. Set the path for saving snapshots on the FTP server and the file name format. For example, set path as Preset No.\\IP Address\\Date, and set file name as Preset No.-PTZ Latitude-PTZ Longitude-PTZ Zoom.jpg.
- 4. Click Save.
- General
- Port Mapping
- 1. Click Setup > Network > Port. Go to Port Mapping tab.
- 2. Enable Port Mapping and select mapping type. If Manual is selected, then external ports must be configured (external IP is obtained automatically by the camera). If the configured port is occupied, then the Status will show Inactive.
- 3. Click Save.
- DNS
- DDNS
- EZCloud
- 802.1x
- Ethernet
- Image Configuration
- Image Adjustment
- Setting the Scene
- 1. Click Scenes.
- 2. Select a scene, and then set scene switching parameters. The following table describes some major parameters.
- 3. Select a scene and then click to set it as the default scene.
- 4. If auto-switching is enabled, the camera can switch to the scene automatically when the condition for switching to a non-default scene is met. Otherwise, the camera remains in the default scene. When auto-switching is not enabled, the camera remain...
- Image Enhancement
- Exposure
- Smart Illumination
- Focus
- White Balance
- Advanced
- Lighting Type
- Configuring Iris and Lens Mode
- Setting the Scene
- OSD Setting
- Privacy Mask
- Image Adjustment
- Audio and Video Configuration
- Video Configuration
- Audio Configuration
- Snapshot
- ROI
- Media Stream Configuration
- Media Stream
- 1. Click Setup > Video & Audio > Media Stream.
- 2. Click , select a stream type, and then set the IP address and port number of the unicast or multicast group for the decoding device that receives audio and video streams from the camera.
- 3. To delete a stream, click .
- 4. Click Submit to complete the operations.
- RTSP Multicast Address
- Media Stream
- Intelligent Alarm Configuration
- Smart Settings
- Cross Line Detection
- 1. Click Setup > Intelligent > Smart Settings. Choose Cross Line and then click .
- 2. Select Cross Line Detection.
- 3. In the Detection Rule area, click to add a new detection area. To delete a detection area, click .
- 4. On the small preview window, drag the line to the intended position and set the detection range.
- 5. Set the direction and sensitivity for the camera to decide whether to report a cross line detection alarm.
- 6. Set the alarm-triggered actions and arming schedule as required. For the detailed steps, see the descriptions of alarm-triggered actions in Configuring Motion Detection Alarm.
- 7. Click Save.
- Intrusion Detection
- 1. Click Setup > Intelligent > Smart Settings. Choose Intrusion and then click .
- 2. Select Intrusion Detection.
- 3. In the Detection Rule area, click to add a new detection area. To delete a detection area, click .
- 4. Drag the borders of the box to set the intended position and range.
- 5. Set time threshold, sensitivity, and percentage for the camera to decide whether to report an intrusion detection alarm.
- 6. Set the alarm-triggered actions and arming schedule as required. For the detailed steps, see the descriptions of alarm-triggered actions in Configuring Motion Detection Alarm.
- 7. Click Save.
- Object Moving
- 1. Click Setup > Intelligent > Smart Settings. Choose Object Moving and then click .
- 2. Select Enable Object Moving Detection.
- 3. In the Detection Rule area, click to add a detection area. To delete, click .
- 4. Drag the box to set the position and effective range.
- 5. Set time threshold and sensitivity to decide whether to report an intrusion detection alarm.
- 6. Set the alarm-triggered actions and arming schedule as required. For the detailed steps, see the descriptions of alarm-triggered actions in Configuring Motion Detection Alarm.
- 7. Click Save.
- Object Left
- 1. Click Setup > Intelligent > Smart Settings. Choose Object Left and then click .
- 2. Select Enable Object Left Detection.
- 3. In the Detection Rule area, click to add a detection area. To delete, click .
- 4. Drag the box to set the position and effective range.
- 5. Set time threshold and sensitivity to decide whether to report an intrusion detection alarm.
- 6. Set the alarm-triggered actions and arming schedule as required. For the detailed steps, see the descriptions of alarm-triggered actions in Configuring Motion Detection Alarm.
- 7. Click Save.
- Face Detection
- 1. Click Setup > Intelligent > Smart Settings. Choose Face and then click .
- 2. Drag the borders to set the intended position and range.
- 3. Set detection parameters according to actual needs.
- 4. Set the alarm-triggered actions and arming schedule as required. For the detailed steps, see the descriptions of alarm-triggered actions in Configuring Motion Detection Alarm.
- 5. Click Save.
- 6. Click Start Intelligent Analysis.
- People Counting
- 1. Click Setup > Intelligent > Smart Settings. Choose People Counting and then click .
- 2. Select Enable Passenger Flow Detection. Select a detection mode, set report interval and sensitivity.
- 3. Click Draw Detection Area, and then draw a detection area on the preview window on the left, e.g., a square.
- 4. Click Draw Entrance Direction, and then draw the direction on the preview window on the left. The direction is usually vertical or sloping.
- 5. Set Max. Size and Min. Size under Filter by Object Size. Only objects within the size range will be counted; others will be filtered and not counted. The maximum width or height must be greater than the minimum width or height.
- 6. Set the alarm-triggered actions and arming schedule as required. For the detailed steps, see the descriptions of alarm-triggered actions in Configuring Motion Detection Alarm.
- 7. To reset counting results, click Clear Counting Result.
- 8. Click Save.
- Auto Tracking
- Heat Map
- 1. Click Setup > Intelligent > Smart Settings. Choose Heat Map and then click.
- 2. Select Enable.
- 3. Set Background Update Rate. The greater the value, the quicker the image refreshes.
- 4. Set Sensitivity. The greater the value, the more likely that small objects will be detected.
- 5. Set Min. Object Size. The greater the value, the more small objects will be ignored during detection.
- 6. Set update interval for reporting statistics to the platform.
- 7. Set the alarm-triggered actions and arming schedule as required. For the detailed steps, see the descriptions of alarm-triggered actions in Configuring Motion Detection Alarm.
- 8. Click Save.
- Defocus Detection
- 1. Click Setup > Intelligent > Smart Settings. Choose Defocus and then click .
- 2. Select Defocus Detection.
- 3. Set detection sensitivity and alarm-triggered actions as required. For the detailed steps, see the descriptions of alarm-triggered actions in Configuring Motion Detection Alarm.
- 4. Click Save.
- Scene Change Detection
- 1. Click Setup > Intelligent > Smart Settings. Choose Scene Change and then click .
- 2. Select Scene Change Detection.
- 3. Set detection sensitivity. Set the alarm-triggered actions and arming schedule as required. For the detailed steps, see the descriptions of alarm-triggered actions in Configuring Motion Detection Alarm.
- 4. Click Save.
- Advanced Settings
- Common Alarm Configuration
- Configuring Motion Detection Alarm
- Area Detection
- 1. Click Setup > Events > Common Alarm > Motion Detection. Set Detection Mode to Area.
- 2. In the Detection Area area, click to add a new detection area. To delete a detection area, click .
- 3. Click and drag the mouse to set a detection area.
- 4. Set the detection sensitivity, object size, and history for the camera to decide whether to report a motion detection alarm.
- 5. Set the alarm parameters.
- 6. Set actions to be triggered by motion detection alarm and the plan.
- 7. Click Save.
- Grid Detection
- 1. Click Setup > Events > Motion Detection. Set Detection Mode to Grid.
- 2. Detection area(s) can be irregular on the grid.
- 3. Set detection sensitivity for the camera to decide whether to report a motion detection alarm (alarm visible on compatible NVR).
- 4. Set alarm parameters.
- 5. Set actions to be triggered by motion detection alarm and the plan. For the detailed steps, see the descriptions of alarm-triggered actions in Area Detection in Configuring Motion Detection Alarm.
- 6. Click Save.
- Area Detection
- Configuring Tampering Alarm
- 1. Click Setup > Events > Common Alarm >Tampering Alarm.
- 2. Select On for Tampering Alarm.
- 3. Set detection sensitivity and duration for the camera to decide whether to report a tampering alarm.
- 4. Set actions to be triggered by tampering alarms and the plan. For the detailed steps, see the descriptions of alarm-triggered actions in Configuring Motion Detection Alarm.
- 5. Click Save.
- Configuring Audio Detection Alarm
- 1. Click Setup > Events > Common Alarm >Audio Detection.
- 2. Select Enable for Audio Detection, select a detection type and set the difference or threshold. To disable audio detection, clear the Enable check box.
- 3. Set the alarm-triggered actions and arming schedule as required. For the detailed steps, see the descriptions of alarm-triggered actions in Configuring Motion Detection Alarm.
- 4. Click Save.
- Configuring Alarm Input
- 1. Click Setup > Events > Common Alarm > Alarm Input.
- 2. Select alarm and set the alarm name.
- 3. Select N.O. or N.C. according to the type of the third-party alarm input device. For example, if the third-party alarm input device is normally open, you need to select N.O. here, so that the camera can receive alarm information from the third-part...
- 4. Set actions to be triggered by an input alarm and the plan. For the detailed steps, see the descriptions of alarm-triggered actions in Configuring Motion Detection Alarm.
- 5. Click Save.
- Configuring Alarm Output
- 1. Click Setup > Events > Common Alarm > Alarm Output.
- 2. Select the alarm and set the alarm name.
- 3. Set the status to N.O. (default setting) and set the alarm duration.
- 4. Set actions to be triggered by an input alarm and the plan. For the detailed steps, see the descriptions of alarm-triggered actions in Configuring Motion Detection Alarm.
- 5. Click Save.
- Configuring Motion Detection Alarm
- Memory Card Storage
- System Maintenance
- Security
- Setting the System Time
- Setting Servers
- Serial Port Mode Configuration
- PTZ control
- Transparent channel
- 1. Click Setup > System > Ports & Devices, and then click the Serial Port tab.
- 2. Select Trans-Channel from the Port Mode drop-down list.
- 3. Select Enable for Trans-Channel.
- 4. Enter the destination IP address and port number (IP address and port number that the transparent channel connects to).
- 5. Click Save.
- OSD
- ONVIF Transparent Channel
- Wiper Control
- Viewing Device Status
- Photo Storage Status
- Upgrading the Device
- 1. Click Setup > System > Maintenance.
- 2. Under Software Upgrade, click Browse and select the correct upgrade file.
- 3. Click Upgrade and then confirm to start. The camera will restart automatically after the upgrade is completed. Some devices support boot program upgrade. To upgrade, select Upgrade Boot Program.
- 4. You may click Detect to check for new versions available to cloud upgrade.
- Restarting the System
- Importing and Exporting System Configuration File
- 1. Click Setup > System > Maintenance.
- 2. To import configurations that you have backed up, click Browse next to the Import button and select the configurations you want to import, and then click Import. The result will be displayed.
- 3. To export current system configurations, click Browse (next to the Exporting field), set the destination and then click Export.
- 4. To restore default configurations, click Default and then confirm the operation. The device will restart and restore the default configurations. Clicking Default with the check box selected will completely restore the device to factory default sett...
- Collecting Diagnosis Information
- Focus Configuration
- Device Mounting Height
- Fisheye Camera Parameter
- 4 Live View
- 5 Video Playback and Download with Edge Storage
- Video Playback
- Download
- 1. Click Playback on the home page.
- 2. Search for video within a specified period. The results will be shown in a list.
- 3. Select your video and click Download. The video will be downloaded to your local path from the memory card (local path can be changed in Local Settings).
- 4. Click Open to show the folder where the downloaded video is saved.
- 6 PTZ Control
- PTZ Control Toolbar
- Setting Patrol by Presets
- Setting Presets
- Setting Patrol
- Add a patrol route
- 1. On the Live View page, click Patrol on the control panel.
- 2. Click .
- 3. On the Add Patrol page, enter the route ID and name, and then click Add to add a patrol action. Up to 64 actions are allowed. Each line includes two actions when action type is set to Move Direction and Zoom, so 32 actions are allowed. Use the butt...
- 4. Click OK.
- Record a patrol route
- 1. On the Live View page, click Patrol on the control panel.
- 2. Click to start recording the patrol route. You can adjust the direction and zoom of the camera during the recording. The system records the motion and track of the camera and adds them to the action list.
- 3. Click to finish recording. Then the patrol route is saved as a mode route automatically. You can click to start patrol or to delete the mode route.
- Make a patrol plan
- Start a patrol route
- Edit a patrol route
- Delete a patrol route
- Add a patrol route
- Setting Home Position
- Remote Control PTZ
- PTZ Limit
- 1. Click Setup > PTZ > PTZ Limit.
- 2. Use directional buttons to rotate the camera to an intended position.
- 3. Click to set the current position as a limit. For example, click on the top to set the upper limit. Clicking will rotate the camera to the current position if the direction has been changed.
- 4. Repeat the above steps to set all limits as needed (up, down, left, right).
- 5. Click Save.
- 6. Click Start PTZ Limit to apply the setting.
- 7. Click to delete settings and reset the limit.
- Resume Patrol
- Appendix A Glossary
- Appendix B FAQ

42
2. Set tracking timeout (unit: sec) and zoom ratio.
3. Click Save.
Heat Map
The heat map uses different colors to display visitor traffic patterns. A dark color, red, for example,
indicates higher traffic density.
1. Click Setup > Intelligent > Smart Settings. Choose Heat Map and then click .
2. Select Enable.
3. Set Background Update Rate. The greater the value, the quicker the image refreshes.
4. Set Sensitivity. The greater the value, the more likely that small objects will be detected.
5. Set Min. Object Size. The greater the value, the more small objects will be ignored during detection.
6. Set update interval for reporting statistics to the platform.
热力图