
User manual


PAT700 Total Organic Carbon Analyzer – Startup Page 45
Anatel Operator Manual
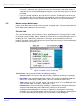
Log view tab
The log view tab displays all analysis readings or events as they would appear on the printout.
The display include all data, up to the last 72 hours, since the last power-up. See Figure 3-4.
Figure 3-4 Home screen, log view tab
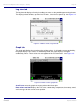
Graph tab
The graph tab displays the past three days of data values. In all modes except conductivity,
the graph displays TOC values. In conductivity mode, the graph displays averaged
conductivity values. These values are averaged over the last 30 minutes. See Figure 3-5.
Figure 3-5 Home screen, graph tab
Scroll icons move the graph cursor one point to the left or right.
Data values text label displays the TOC value, conductivity, temperature, timestamp, trend,
and curve type for the current cursor position.