
Instruction manual


Force Imaging
Force Calibration Mode
180 MultiMode SPM Instruction Manual Rev. B
11.2.1 Example Force Plot
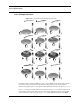
Figure 11.2c Tip-Sample Interaction During a Force Plot
Let’s begin with the simplest of SPM force plots: a contact AFM force plot using a silicon nitride
tip. Because of the lower spring constant of silicon nitride probes, they are more sensitive to
attractive and repulsive forces. A force plot in contact AFM is shown below (see also Figure 11.2c).
Figure 11.2c compares portions of the force curve shown in Figure 11.2d to relative positions of the
tip and sample at seven points. The force curve represents the deflection signal for each complete
extension-retraction cycle of the piezo (Figure 11.2a). The Z scan rate parameter in the Main
1
2
3
4
5
6
7