
User guide


66 Chapter 6: Analyzing Spectrum Data
AirMagnet Spectrum XT User Guide
Show Current Allows the user to show or hide the current power readings in the FFT graph.
Click in the field and use the down arrow to select either of the following:
• Yes - displays the current power readings.
• No - hides the current power readings.
Show Duty Cycle The duty cycle data will overlay the FFT graph as semi-transparent bars
• Yes - displays the duty cycle overlay.
• No - hides the duty cycle overlay.
Show Max-hold Allows the user to show or hide the max-hold power readings in the FFT graph.
Click in the field and use the down arrow to select either of the following:
• Yes - displays the max-hold power readings.
• No - hides the max-hold power readings.
Show Maximum Allows the user to show or hide the maximum power readings in the FFT graph.
Click in the field and use the down arrow to select either of the following:
• Yes - displays the maximum power readings.
• No - hides the maximum power readings.
Enable Marker Allows the user to enable or disable the marker or markers (which is or are tiny
blue dots) on the FFT graph. The marker or markers help you to highlight a
specific point of interest in the FFT graph. Click in the field and use the down
arrow to select either of the following:
• Yes - displays the marker. If selected, You then have to specify a marker
type which can be Single or Delta. See below.
•No - hides the marker.
Marker Type Used only when you select True in the Enable Marker field. It allows you to
choose between Single and Delta. The former only shows one marker, as the
name suggests. The latter shows two markers: one of them stays at a fixed
location on the FFT graph while the other can be dragged around. To effectively
use this feature, you should start with a Single marker and drag it to a point of
interest on the FFT graph. Then select Delta to bring up the second marker. This
will cause the first marker to remain fixed at where you leave it. You can then
drag the second marker to compare the power readings between a fixed data
point and any other data point on the FFT graph.
Click in the field and use the down arrow to select either of the following:
• Single - displays a single maker which can dragged to any point of interest
on the FFT graph.
• Delta - displays two markers: one fixed at a particular location and the other
can be dragged across the FFT plot for comparison. See the above
paragraph.
Note: When Marker is enabled, power readings of the data points marked by the
markers also appear in the upper-left corner of the FFT graph.
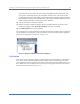
Table 6-2: Setting Real Time FFT Graph Parameters
Parameter Description