
User guide


AirMagnet Spectrum XT User Guide
Chapter 6: Analyzing Spectrum Data 65
To configure Real-Time FFT graph parameters:
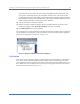
1) From the upper-right corner of the Real Time FFT graph, click (Chart
Configuration). The Real-Time FFT Configuration dialog box. See Figure 6-5.
Figure 6-5: Configuring Real Time FFT graph
2) Make the entries and/or selections as described in the Table 6-2.
3) Click Apply and then OK.
Table 6-2: Setting Real Time FFT Graph Parameters
Parameter Description
Show Area Fill Enables or disables the graph’s ability to fill the area below the displayed line.
Note: This option can be fairly CPU-intensive; consequently, users may
experience improved application performance if this is set to No.
Show Average Allows the user to show or hide the average power readings in the FFT graph.
Click in the field and use the down arrow to select either of the following:
•Yes - displays the average power readings.
• No - hides the average power readings.